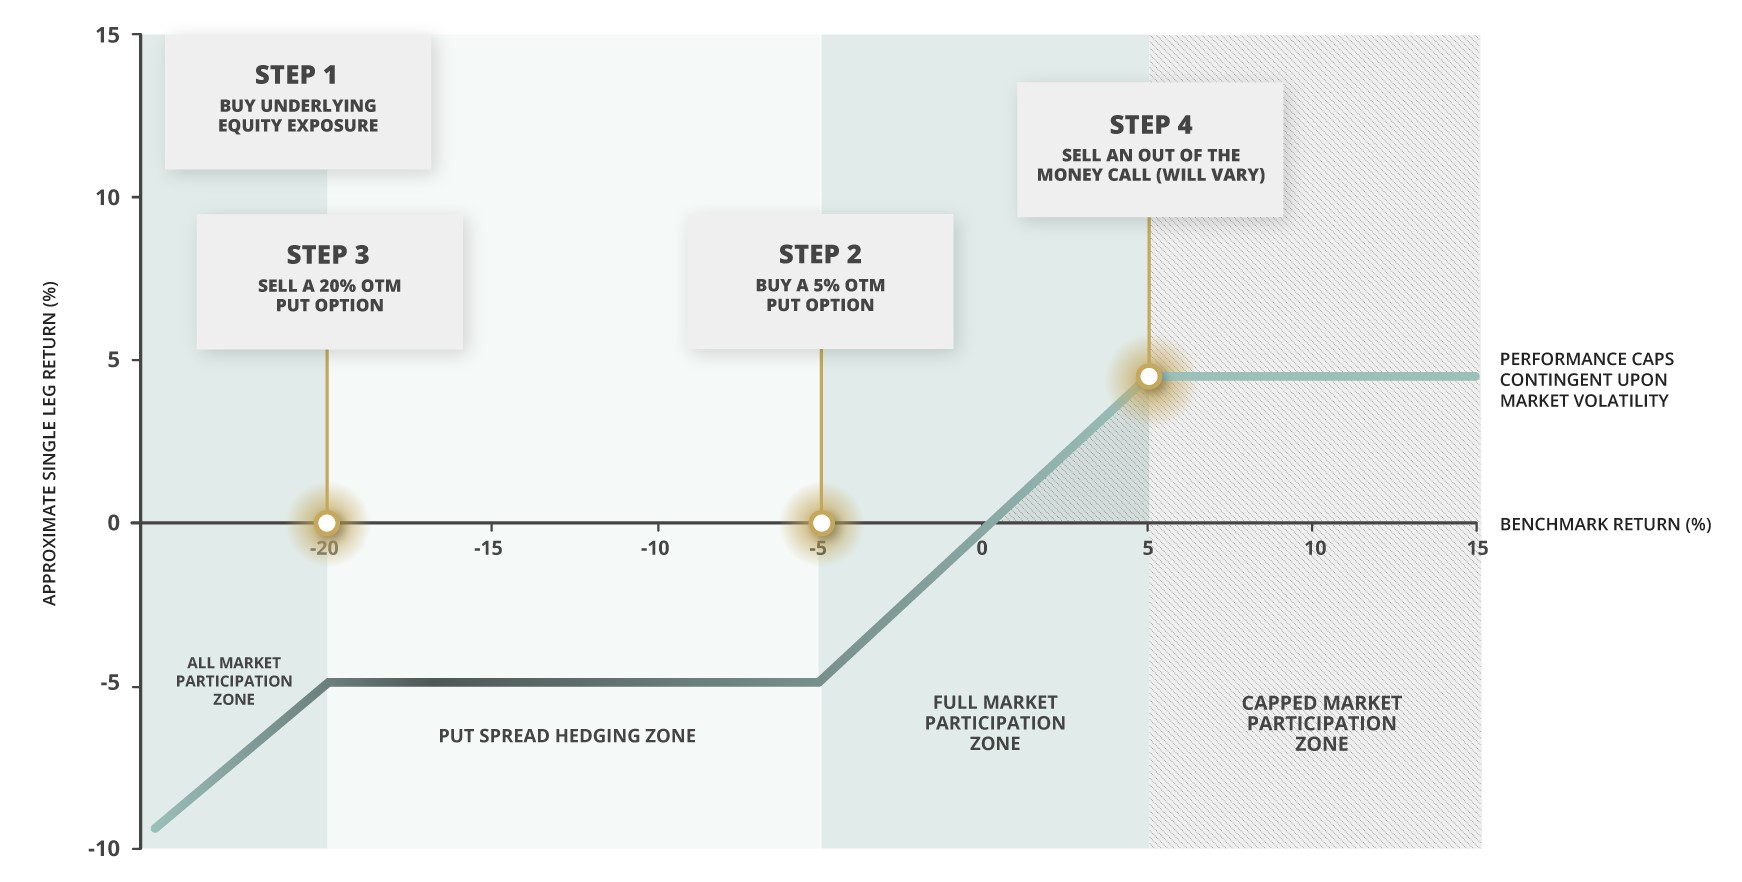
A hedged equity strategy, which is sometimes referred to as a costless collar or defined outcome strategy, is a risk management profile that combines holding a long position in a stock or index with buying a put spread defined by a specific set of strikes (e.g. 5% OTM long put, 20% OTM short put). This provides downside protection for the long stock position if the stock falls within the put spread’s option strikes. The strategy finances the cost of the put spread by writing an out of the money call option with a variable strike depending on market conditions, creating a "costless" approach to balancing risk (Figure 1).
Costless collars have become increasingly popular in recent years due to their ability to provide investors with a balanced approach to managing risk in a stock portfolio. But this strategy can experience vastly different outcomes depending on the expiry of the options. In this blog, we examine the path dependency risks associated with long-term costless collar strategies and review a way to reduce these risks by laddering a series of shorter-dated collars.
Figure 1: Building a Costless CollarSource: Simplify Asset Management
Choosing Your Own Path
One of the potential downsides of costless collars is that they are subject to path dependency risk. Path dependency refers to the fact that the value of the options is dependent on the path that the underlying investment takes, often resulting in widely varied outcomes for similar strategies due to investment timing risk. This type of path dependency risk can materialize in the form of delta path dependency risk (i.e., the sensitivity to downside or upside participation) or monetization path dependency, which can result in hitting the put floor or call ceiling strikes of the collar.
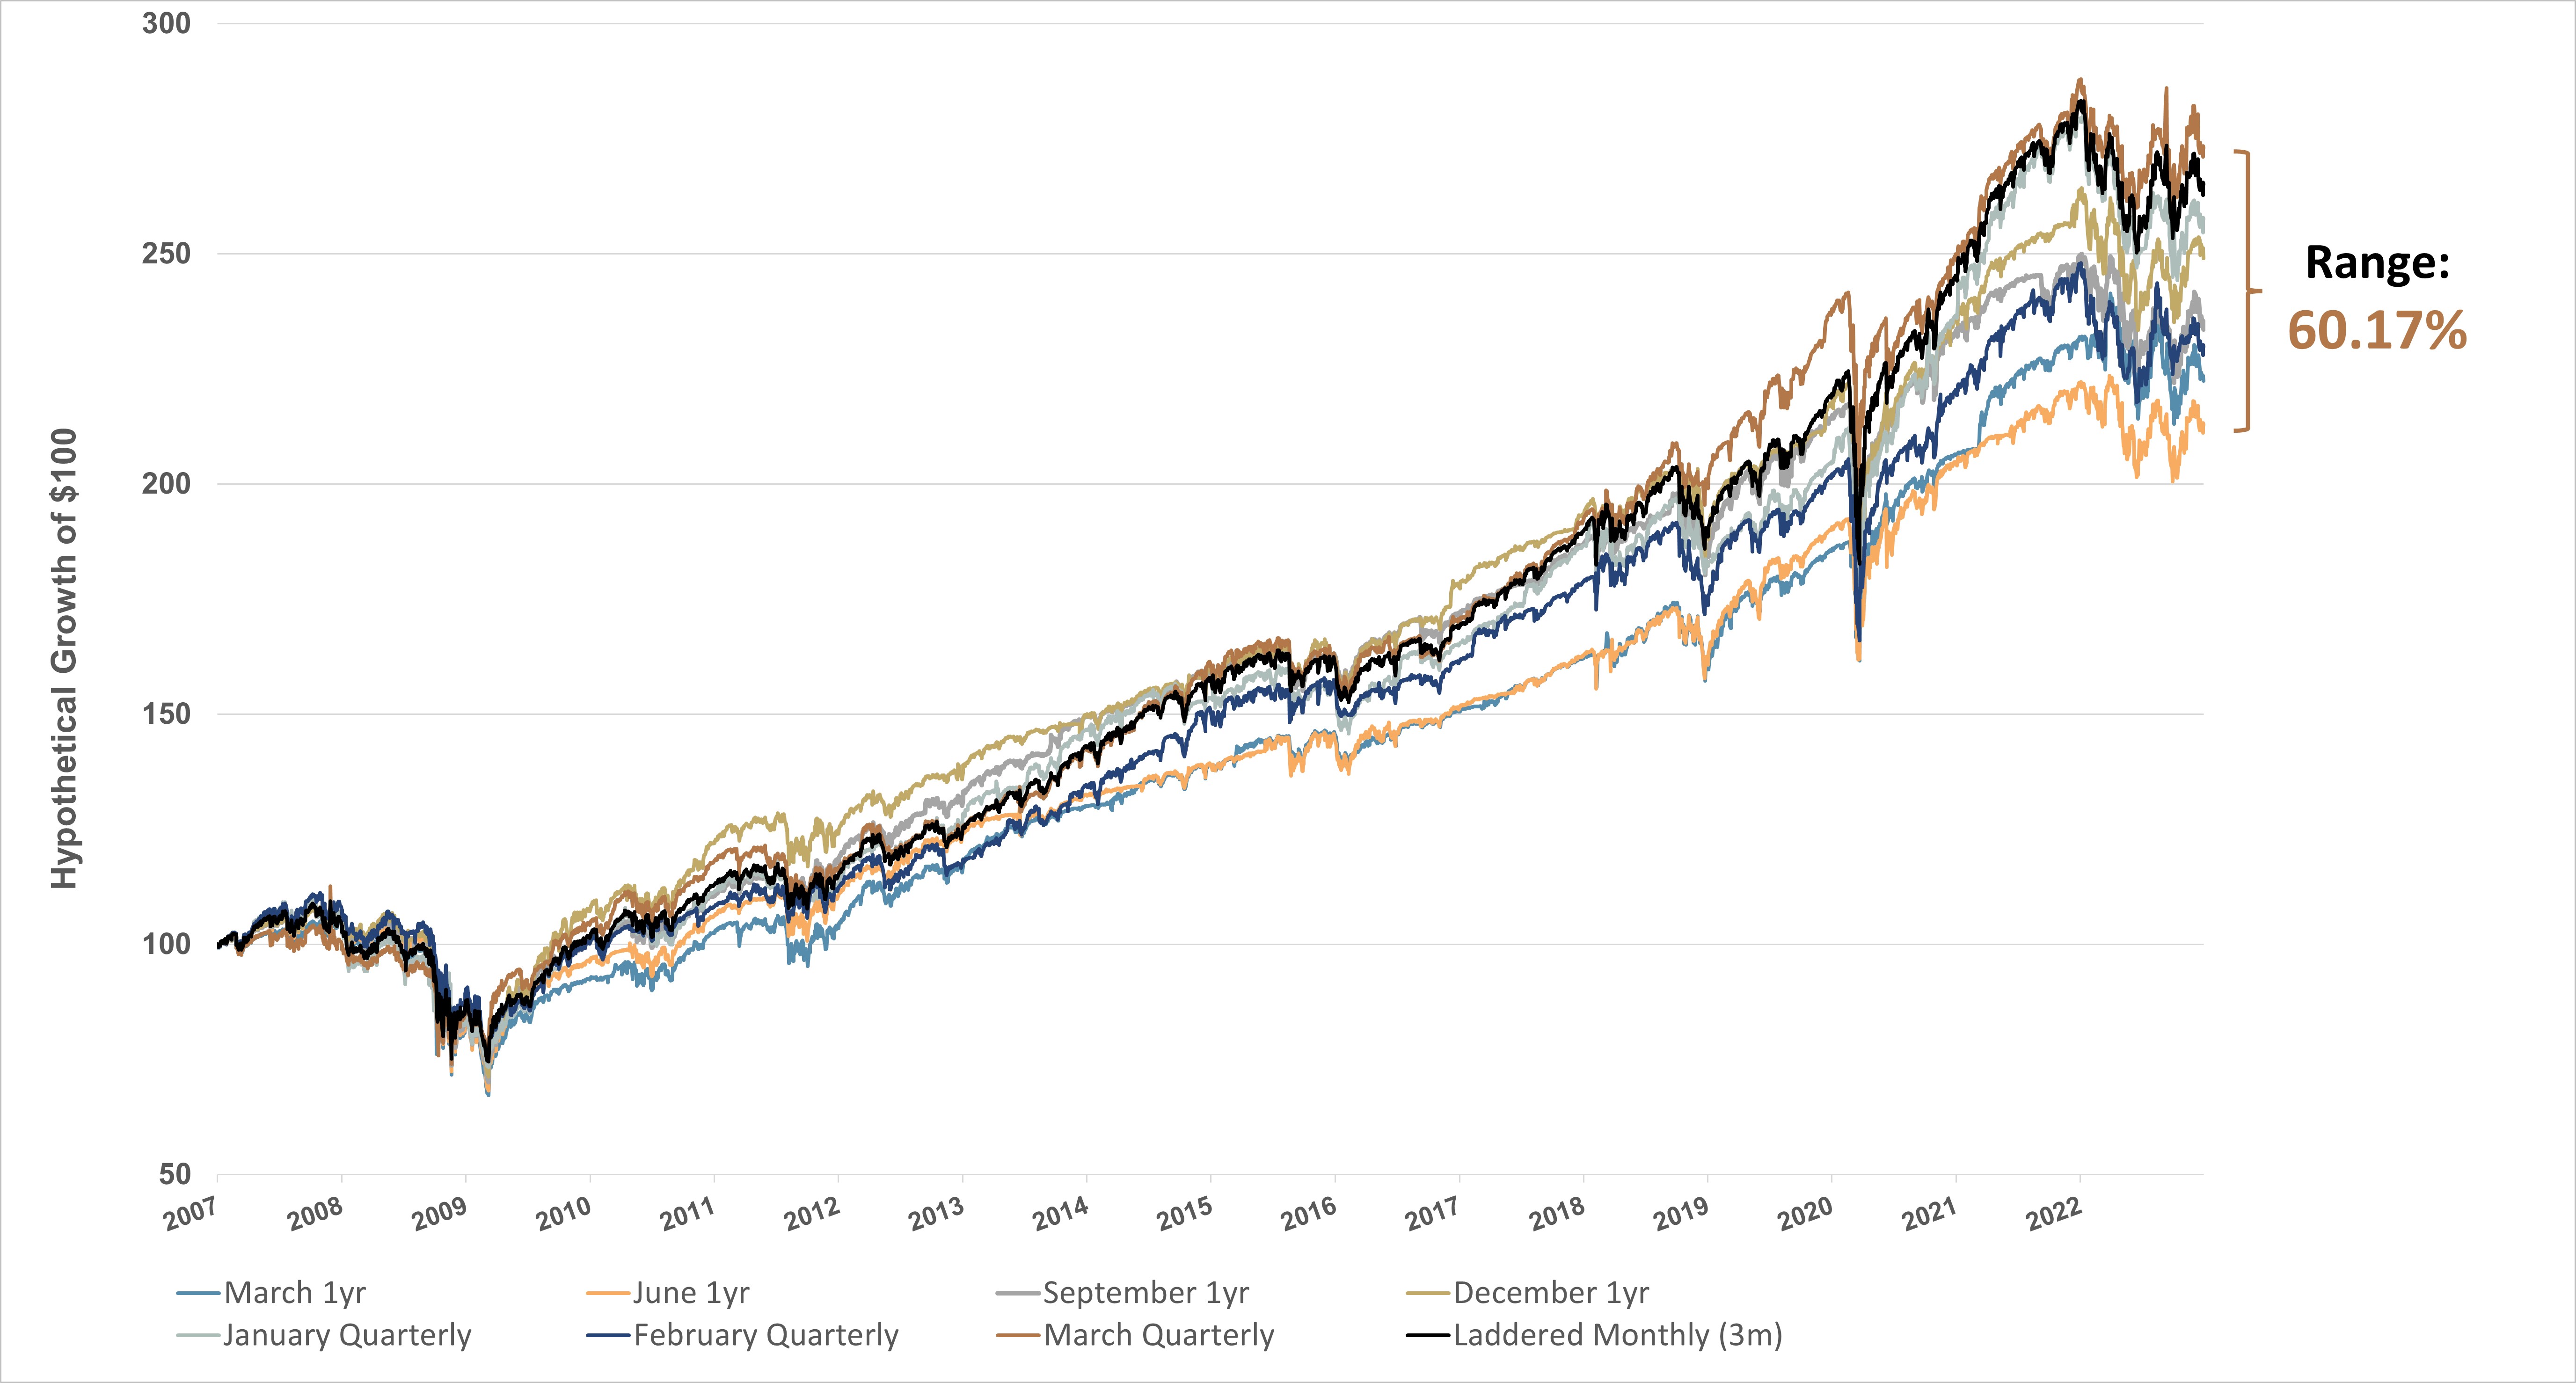
To examine these risks, we constructed four costless collar strategies on the S&P 500 Index™* (SPX) with annual resets of March, June, September, and December. Next, we added three additional strategies that increased the frequency of the collar resets to quarterly (January, February, and March starting months) to test if this would help narrow the spread between the leading and lagging costless collar strategies. In fact, the dispersion widened among the quarterly configurations despite producing, on average, better long-term cumulative returns.
Finally, we increased the frequency yet again, adding a strategy that laddered monthly collar exposures across the forward three months in an attempt to create additional path robustness. To illustrate this configuration, we began with a split exposure to January, February, and March costless collars. Upon the expiry of the January collar, we then initiated a new April position, and so on and so forth. The laddered strategy outperformed all but one (March Quarterly) of the prior annual and quarterly strategies, and posted a cumulative total return of over 165% during the assessed period, well above its peer average. Figure 2 shows the results of our study.
Figure 2: Annual vs. Quarterly vs. Laddered (3m forward, monthly)
12/31/2006 – 12/31/2022Source: Simplify Asset Management, Bloomberg
The results are hypothetical and are NOT an indicator of future results and do NOT represent returns that any investor actually attained. Hypothetical strategies and indices presented are unmanaged, calculated on a total return basis, do not reflect management or trading fees, and one cannot invest directly in an index. Additional information regarding the construction of these results is available upon request. Standard & Poor’s 500 Composite IndexSM and S&P 500® are service/trademarks owned by The McGraw-Hill Companies, Inc. PLEASE SEE FULL DISCLOSURES BELOW.
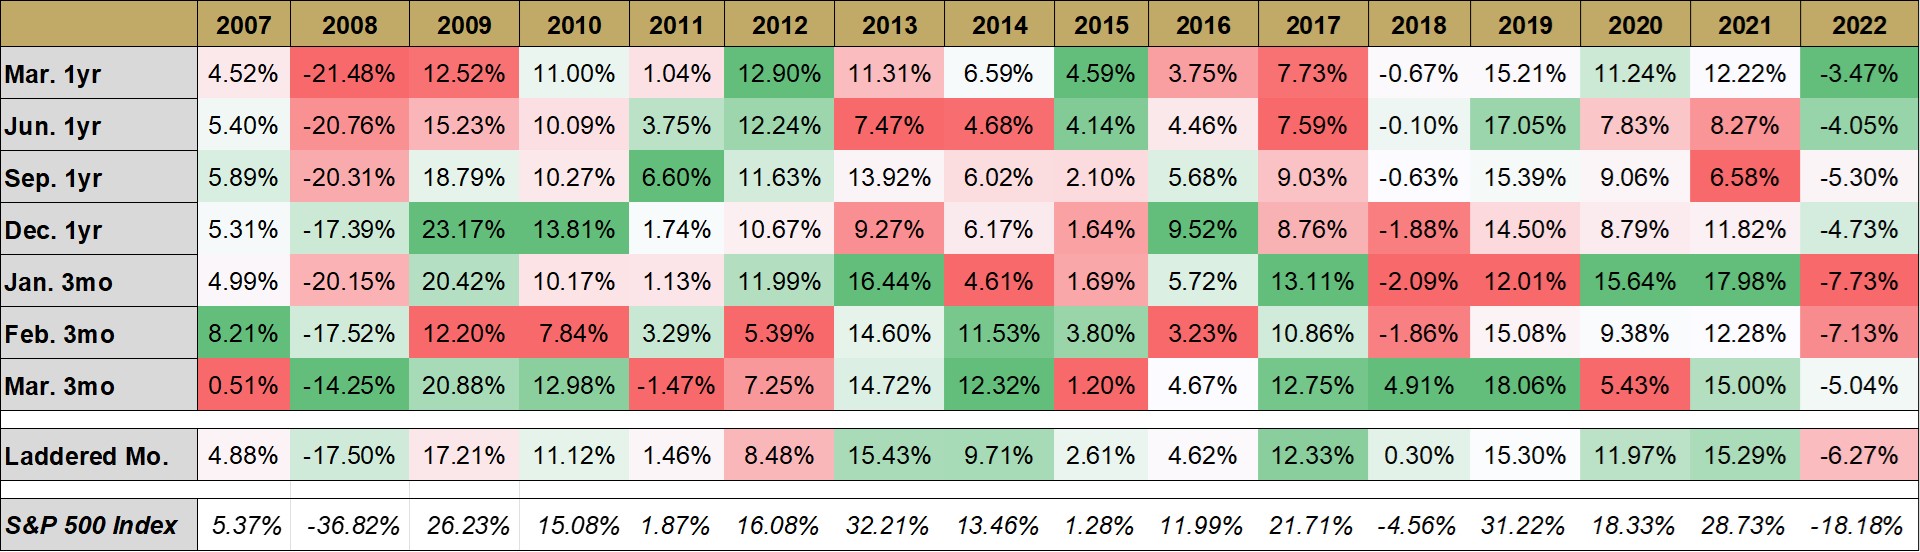
We expected the monthly strategy to be in the middle of the pack due to smoothing out random path effects, but indeed we see it performing near the top of the pack. So why the outperformance? In Figure 3, we show the calendar year returns for all hedged equity configurations, noting that the laddered monthly configuration was never the best or worst performing strategy in any single year.
Figure 3: Calendar Year Returns for Hedged Equity Configurations 12/31/2006 – 12/31/2022Sources: Simplify Asset Management, Bloomberg.
The results are hypothetical and are NOT an indicator of future results and do NOT represent returns that any investor actually attained. Hypothetical strategies and indices presented are unmanaged, calculated on a total return basis, do not reflect management or trading fees, and one cannot invest directly in an index. Additional information regarding the construction of these results is available upon request. Standard & Poor’s 500 Composite IndexSM and S&P 500® are service/trademarks owned by The McGraw-Hill Companies, Inc. PLEASE SEE FULL DISCLOSURES BELOW.
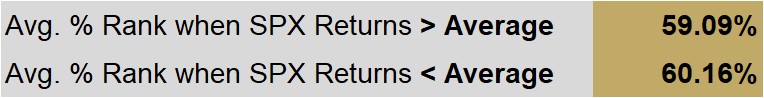
Further, the higher frequency strategy ranked in the 59th performance percentile (top half) during periods when SPX outperformed its historical quarterly return average. It also produced a similarly impressive percentile ranking of 60.16% during below average return periods, as shown in Figure 4. We attribute this success to the increased rebalance frequency of the collars, allowing for a higher probability of resetting both upside and downside strikes to capture modest yet statistically significant relative wins that compound over time.
Figure 4: Performance Percentile Rankings for Laddered Monthly Configuration 12/31/2006 – 12/31/2022Sources: Simplify Asset Management, Bloomberg.
The results are hypothetical and are NOT an indicator of future results and do NOT represent returns that any investor actually attained. Hypothetical strategies and indices presented are unmanaged, calculated on a total return basis, do not reflect management or trading fees, and one cannot invest directly in an index. Percentile rankings calculated on a quarterly return basis over the assessed return period. Additional information regarding the construction of these results is available upon request. Standard & Poor’s 500 Composite IndexSM and S&P 500® are service/trademarks owned by The McGraw-Hill Companies, Inc. PLEASE SEE FULL DISCLOSURES BELOW.
Conclusion
With the recent proliferation of costless collar, hedged equity, and defined outcome strategies, investors have no shortage of ways to access this type of exposure. Choosing the wrong configuration can have serious long-term consequences. Despite downside protection often being the focus of a costless collar strategy, the ability to mitigate path risk in both upside call strikes and downside put strikes appears to be the key to producing long-term relative success.
We have shown that investors should strongly consider the path risks associated with longer-term option strikes and use shorter-term resets with laddered collar positions to mitigate selection risk and the opportunity cost associated with it.
*Disclaimer: Standard & Poor’s 500 Composite IndexSM and S&P 500® are service/trademarks owned by The McGraw-Hill Companies, Inc.