Simplify Aggregate Bond PLUS Credit Hedge ETF (AGGH)
Can Bond Investors Outperform the Aggregate Bond Index?
Share

Introduction
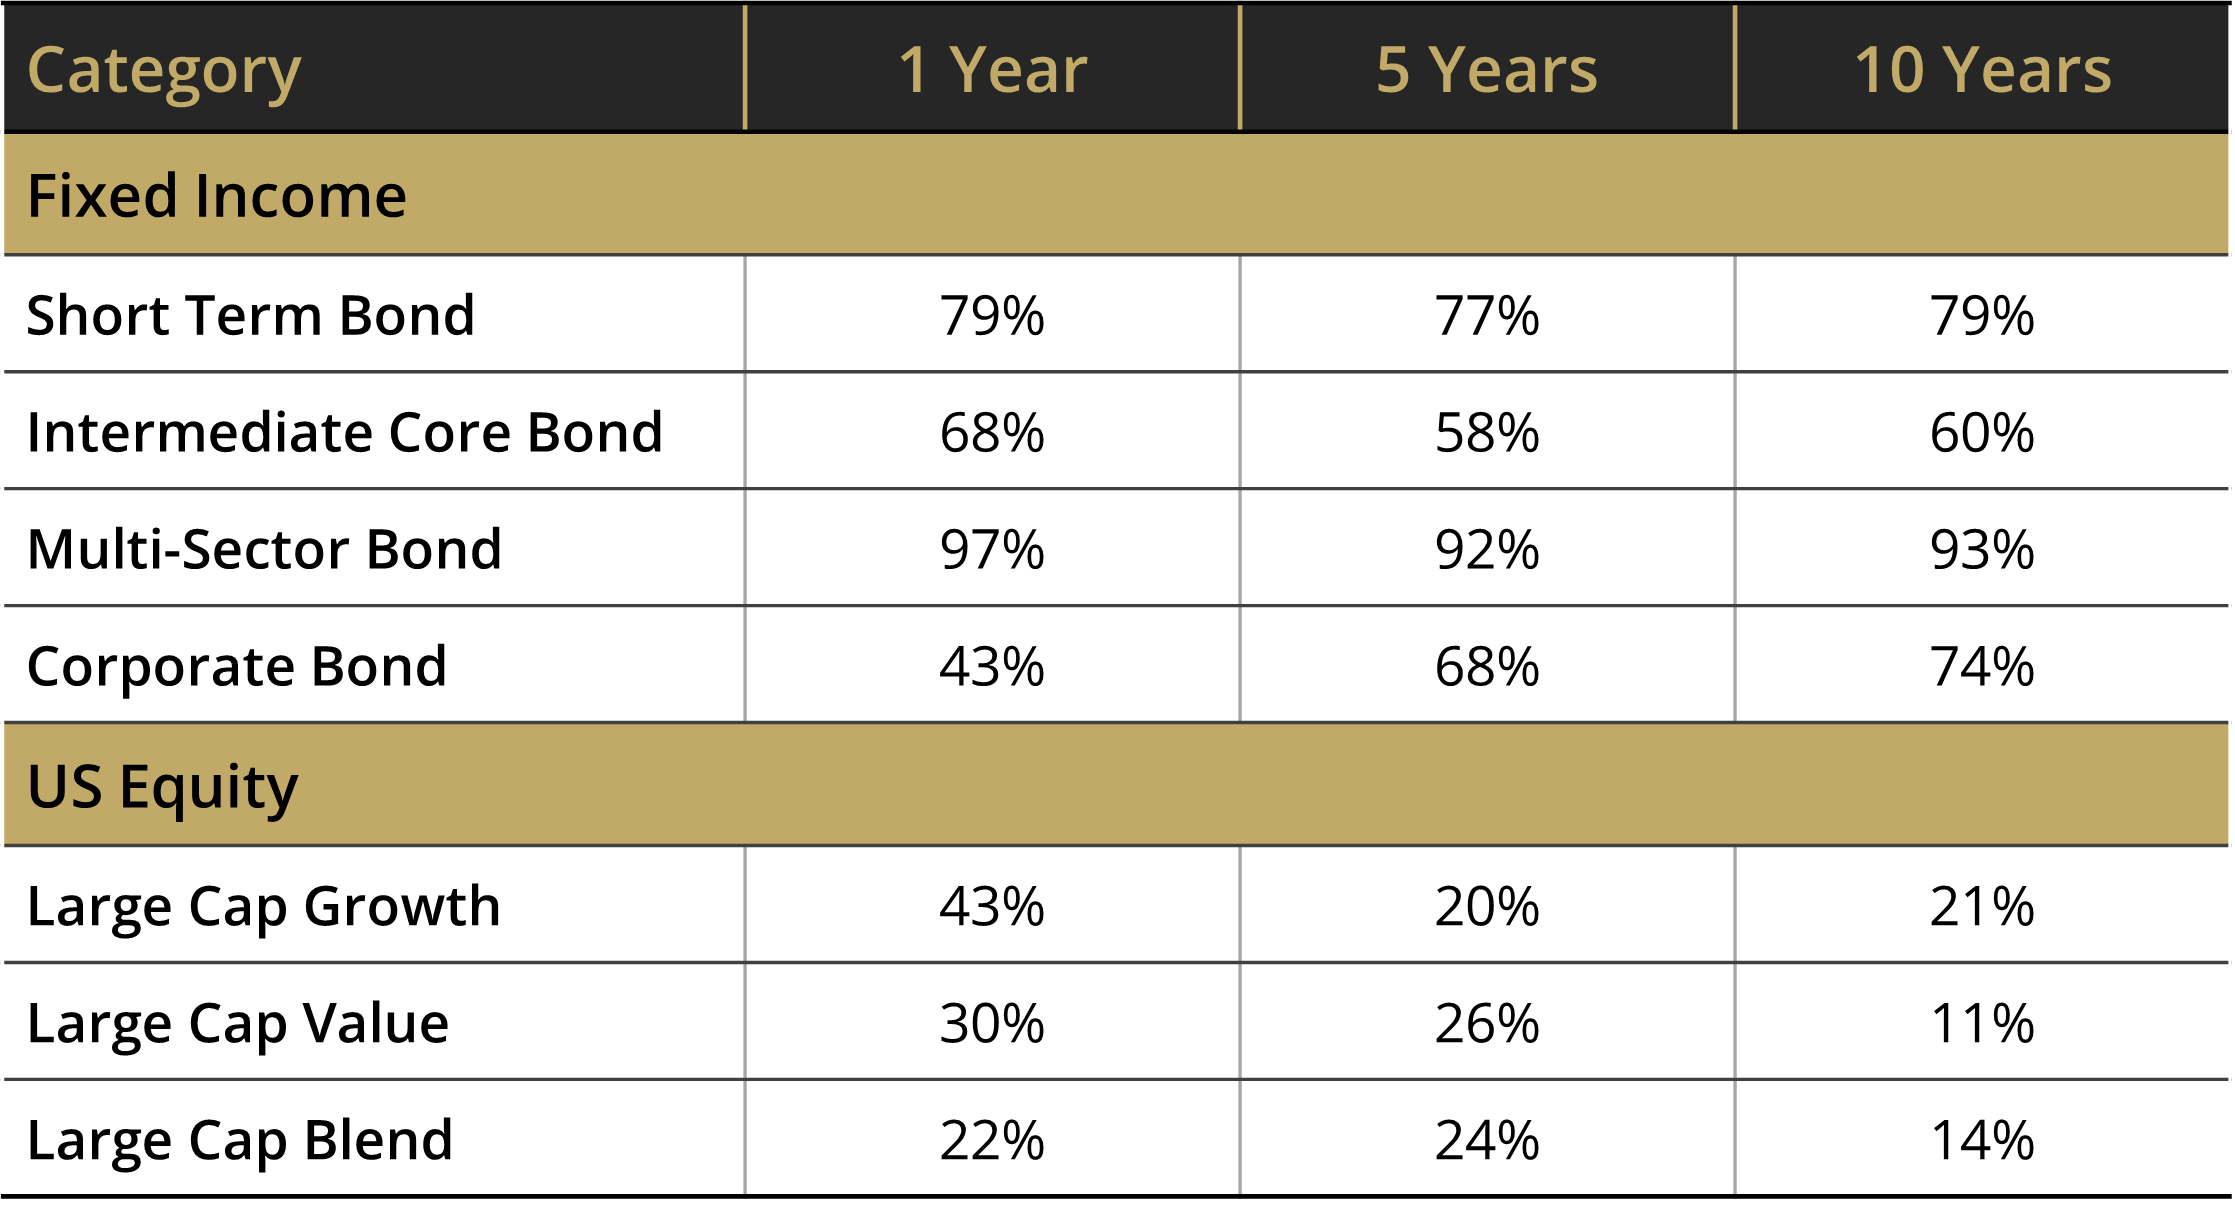
With decades of both passive and active fund performance now in the rear view mirror, the results are unequivocal: active management within fixed income is incredibly compelling, while active management in equities has failed to deliver.Let’s start by checking the scoreboard, shown in Figure 1. We see a very high percentage of actively managed fixed income mutual funds were able to beat their benchmark over the past decade (last column), between 60% and 93%, depending on the asset class. On the opposite side of the spectrum are equity mutual funds, where only a small number of active funds outperformed their benchmark over the trailing decade, between 11% and 21%, depending on the asset class.
Bond Indexes Are Built Differently
On the equity side, indexes are hard for active managers to beat because the weighting of each stock is determined by the collective wisdom of the market. The most heavily weighted stocks in the index are the ones that investors have voted on (with their dollars) as being the most desirable. With millions and millions of talented professional and non-professional investors researching stocks and pouring money into the best ones, it is very hard to outsmart the passive index mix.
It’s natural to assume that bond indexes are built the same as their equity cousins. After all, they are also market capitalization weighted. But there is a substantial difference between how that weighting is determined. With bond indexes, the cap weighting is not determined by the collective wisdom of the market – it’s driven by the supply of bonds. We can see how this works by looking at the Treasury allocation within the Bloomberg Aggregate Bond Index (Figure 2).
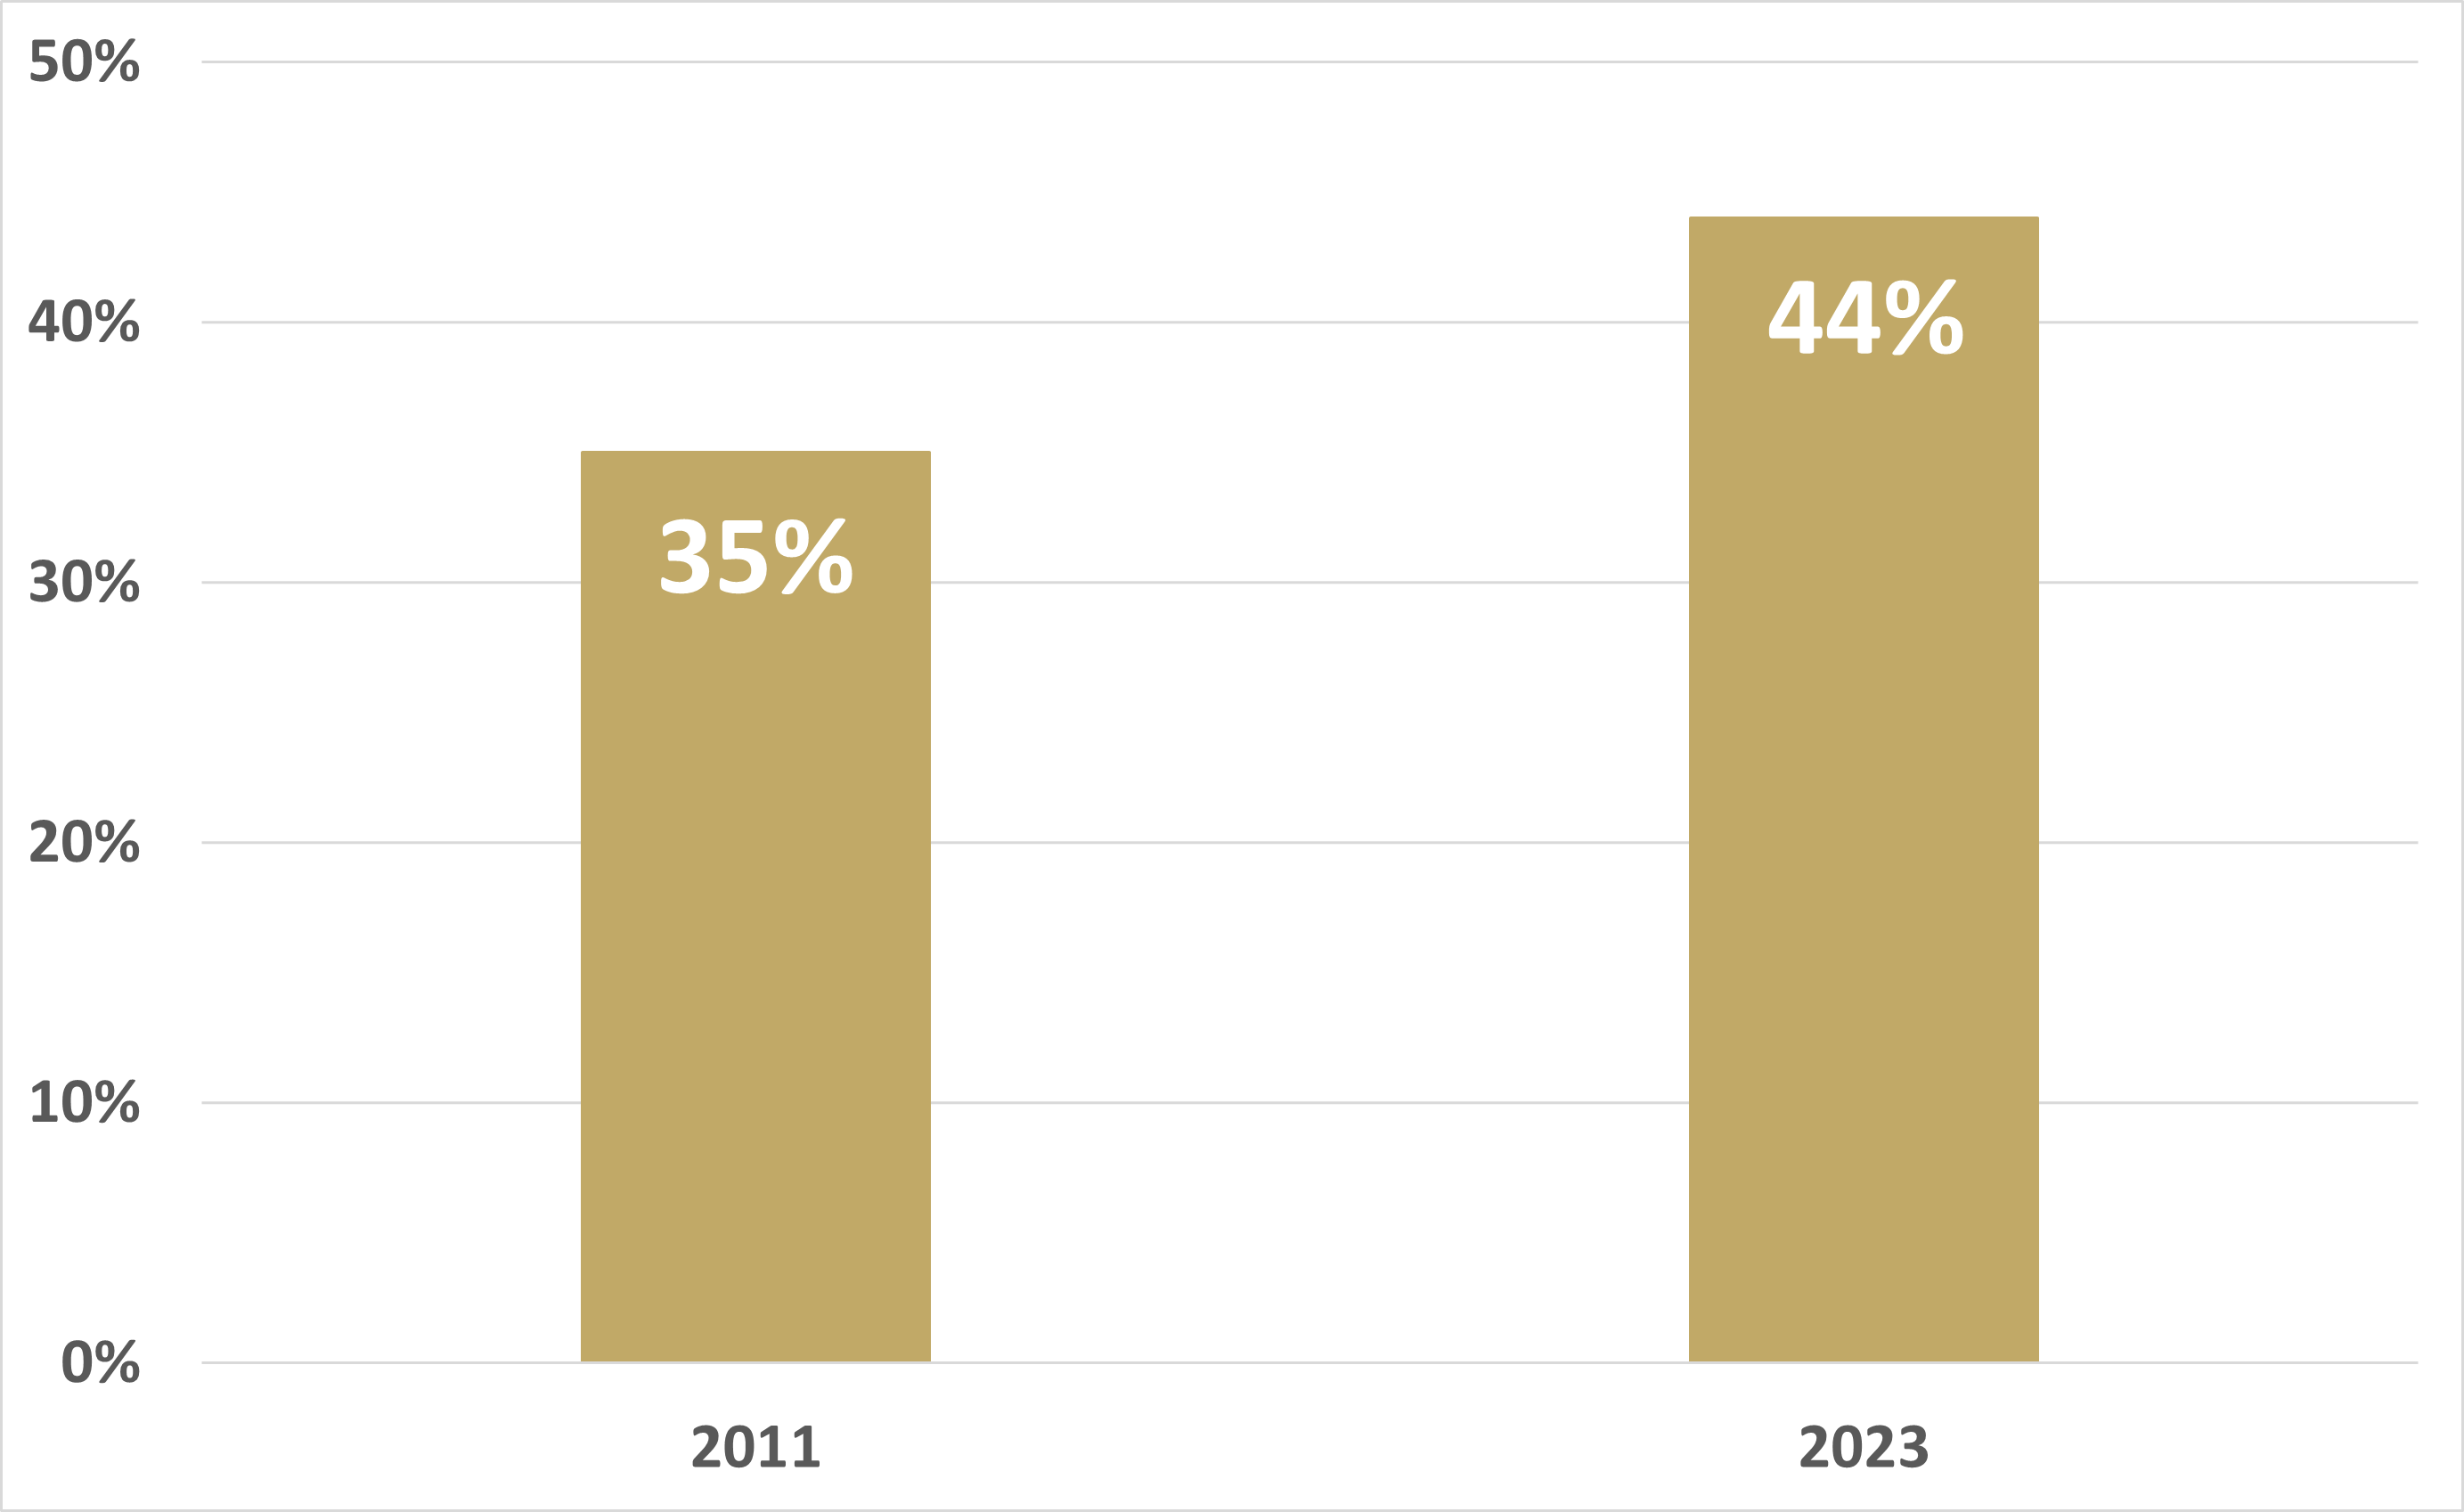
The percentage of Treasury securities in the index has increased significantly, from 35% in 2011 to 44% in 2023. Is this because the collective wisdom of the market has decided that Treasuries are a more attractive investment in 2023 than they were in 2011? No.
Introducing the Simplify Aggregate Bond ETF (AGGH)
AGGH is an actively managed core bond fund with an investment objective of maximizing total return. The goals for AGGH are as follows:
- Create similar fixed income exposure as the Bloomberg Aggregate Bond Index in terms of duration and credit quality
- Provide a higher distribution yield than the index
- Outperform the index on a total return basis
There are several levers that can be pulled in search of greater yields and returns. The next section will review this investment process.
The AGGH Investment Process

Let’s discuss each step in the investment process in more detail.
Step 1
The first step is to buy bonds with the highest risk-adjusted yield. This is the primary lever in active management – buying the sectors of the bond market, but not by issuance, by fundamentals. The fund will seek out the highest yields available without increasing the fund’s credit risk. Here are some examples of how this process works. Keep in mind that holdings can change at any time, so these examples are simply used to demonstrate the investment process.
(1) Treasury Inflation-Protected Securities (TIPS)
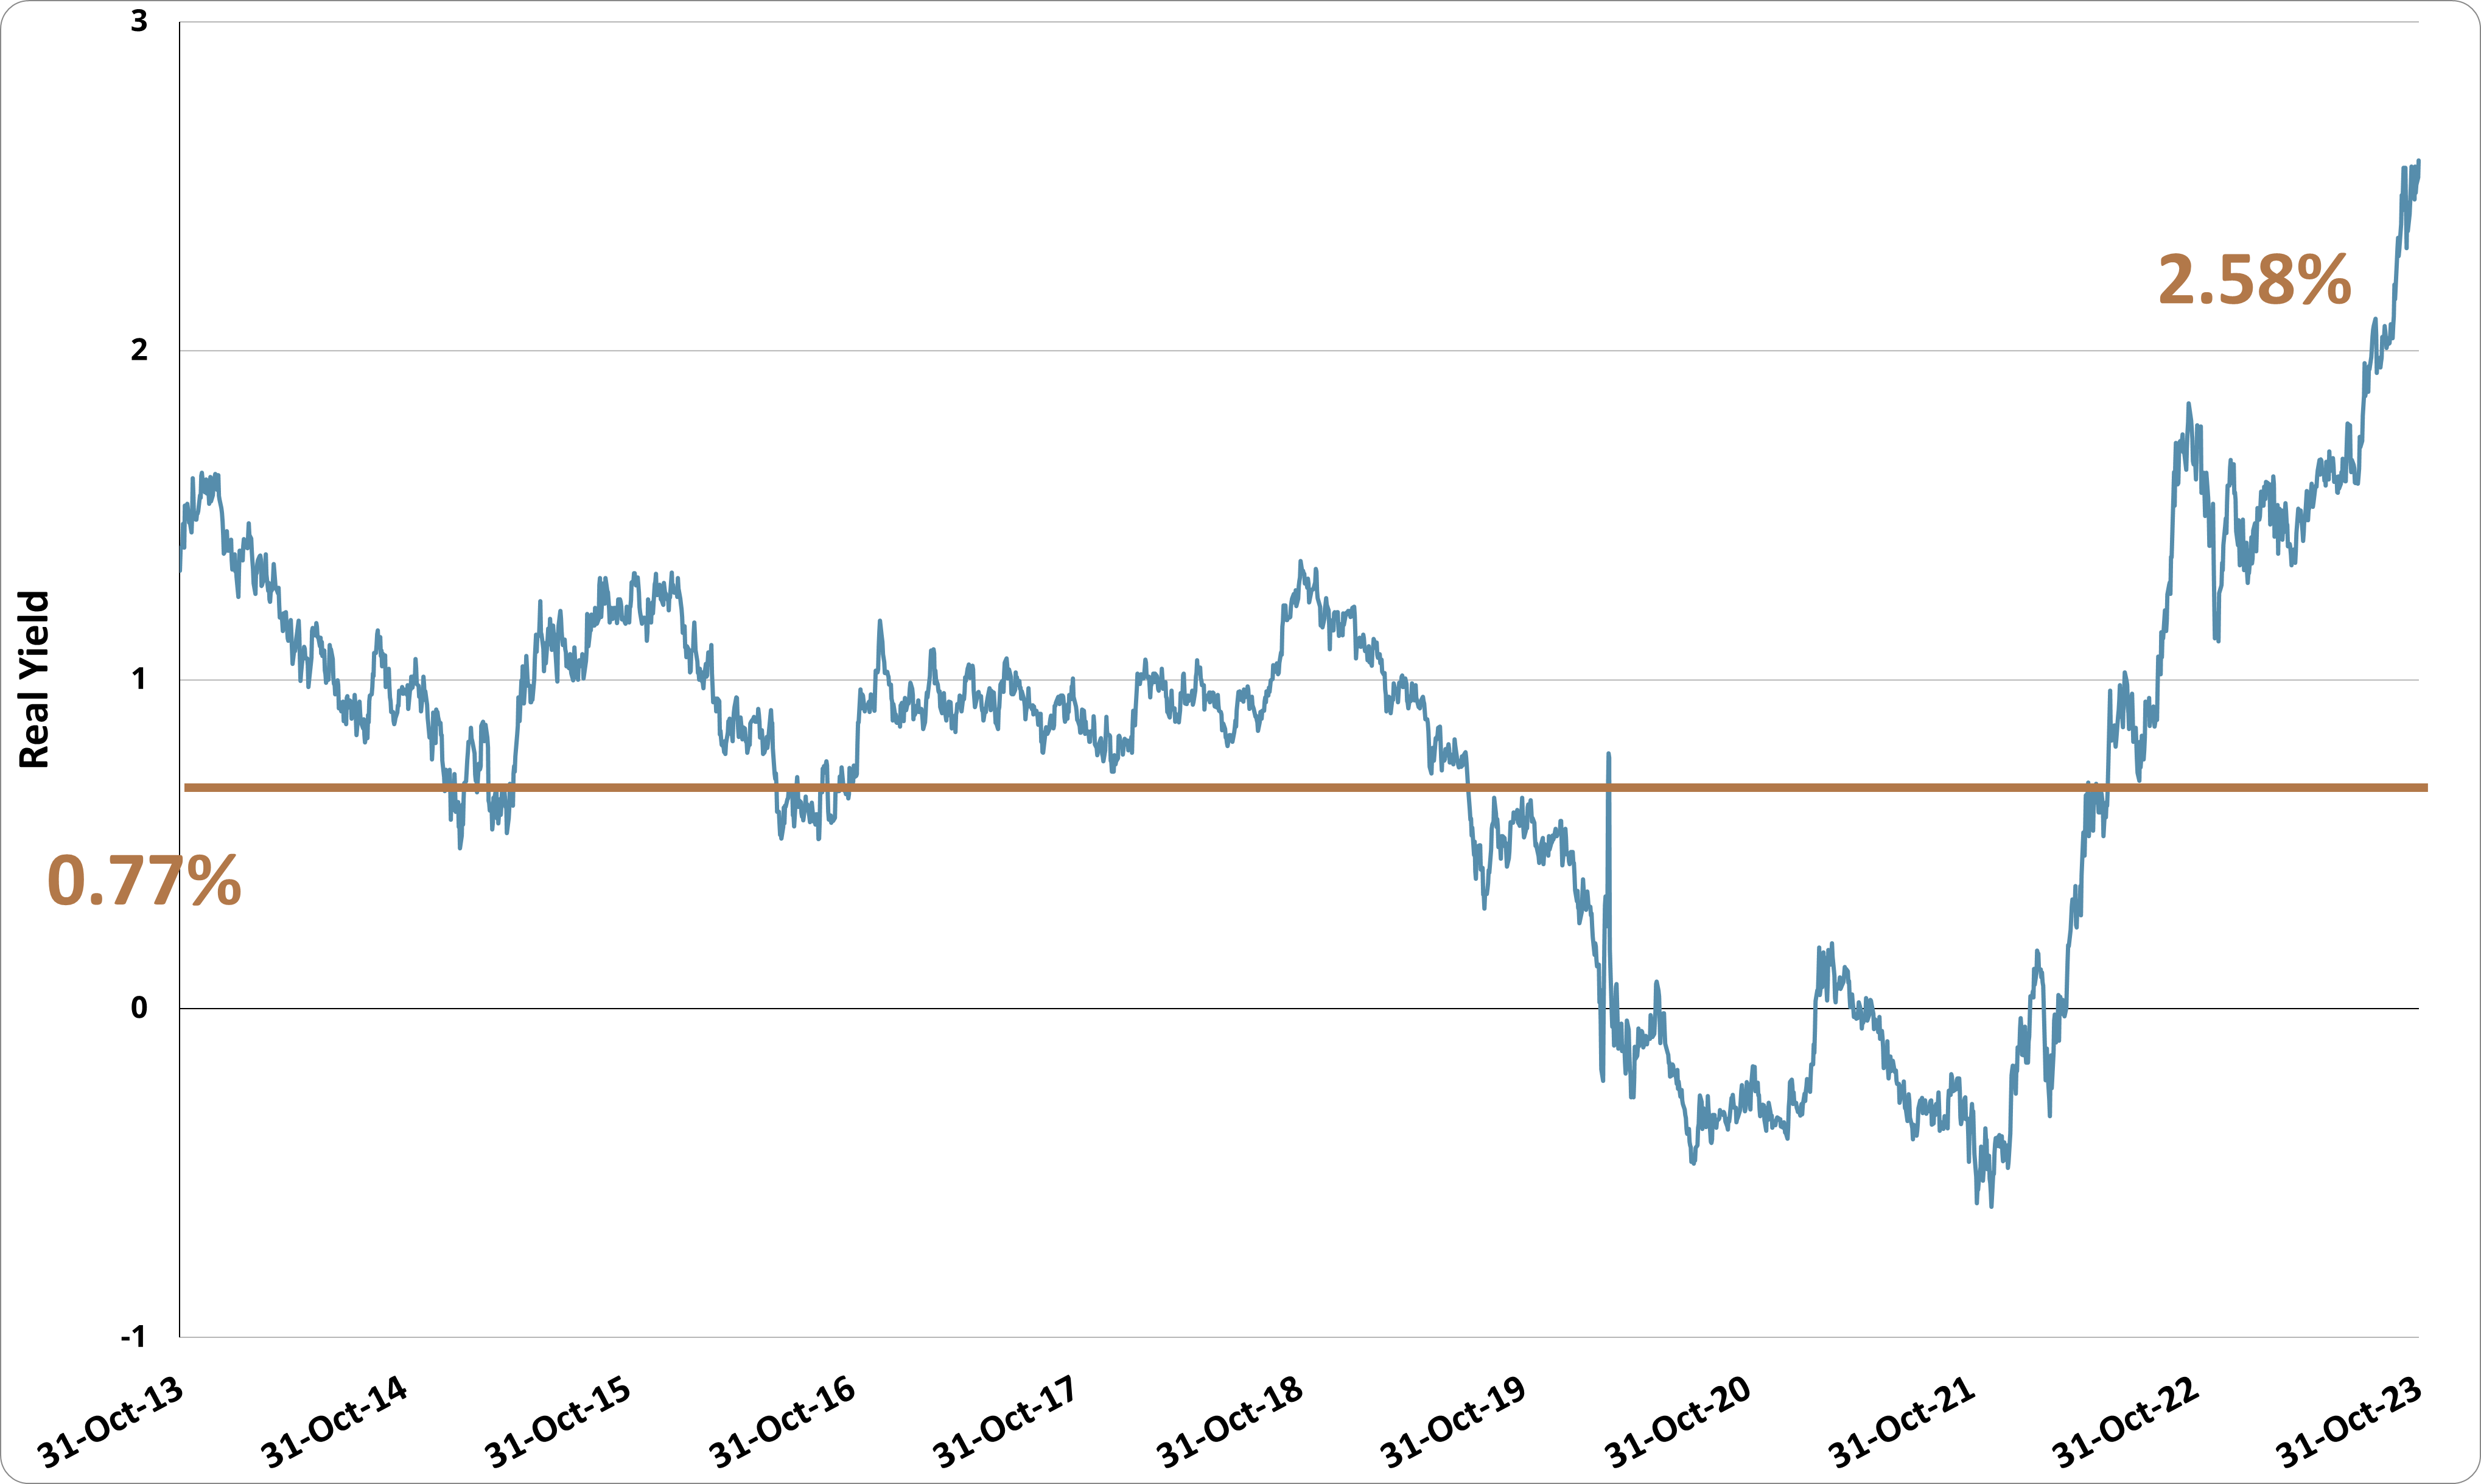
The real yield on 30-year TIPS has averaged 0.77% over the past decade. With real yields now over 2.5%, TIPS are historically attractive, leading to an overweight versus the index (see Figure 3).
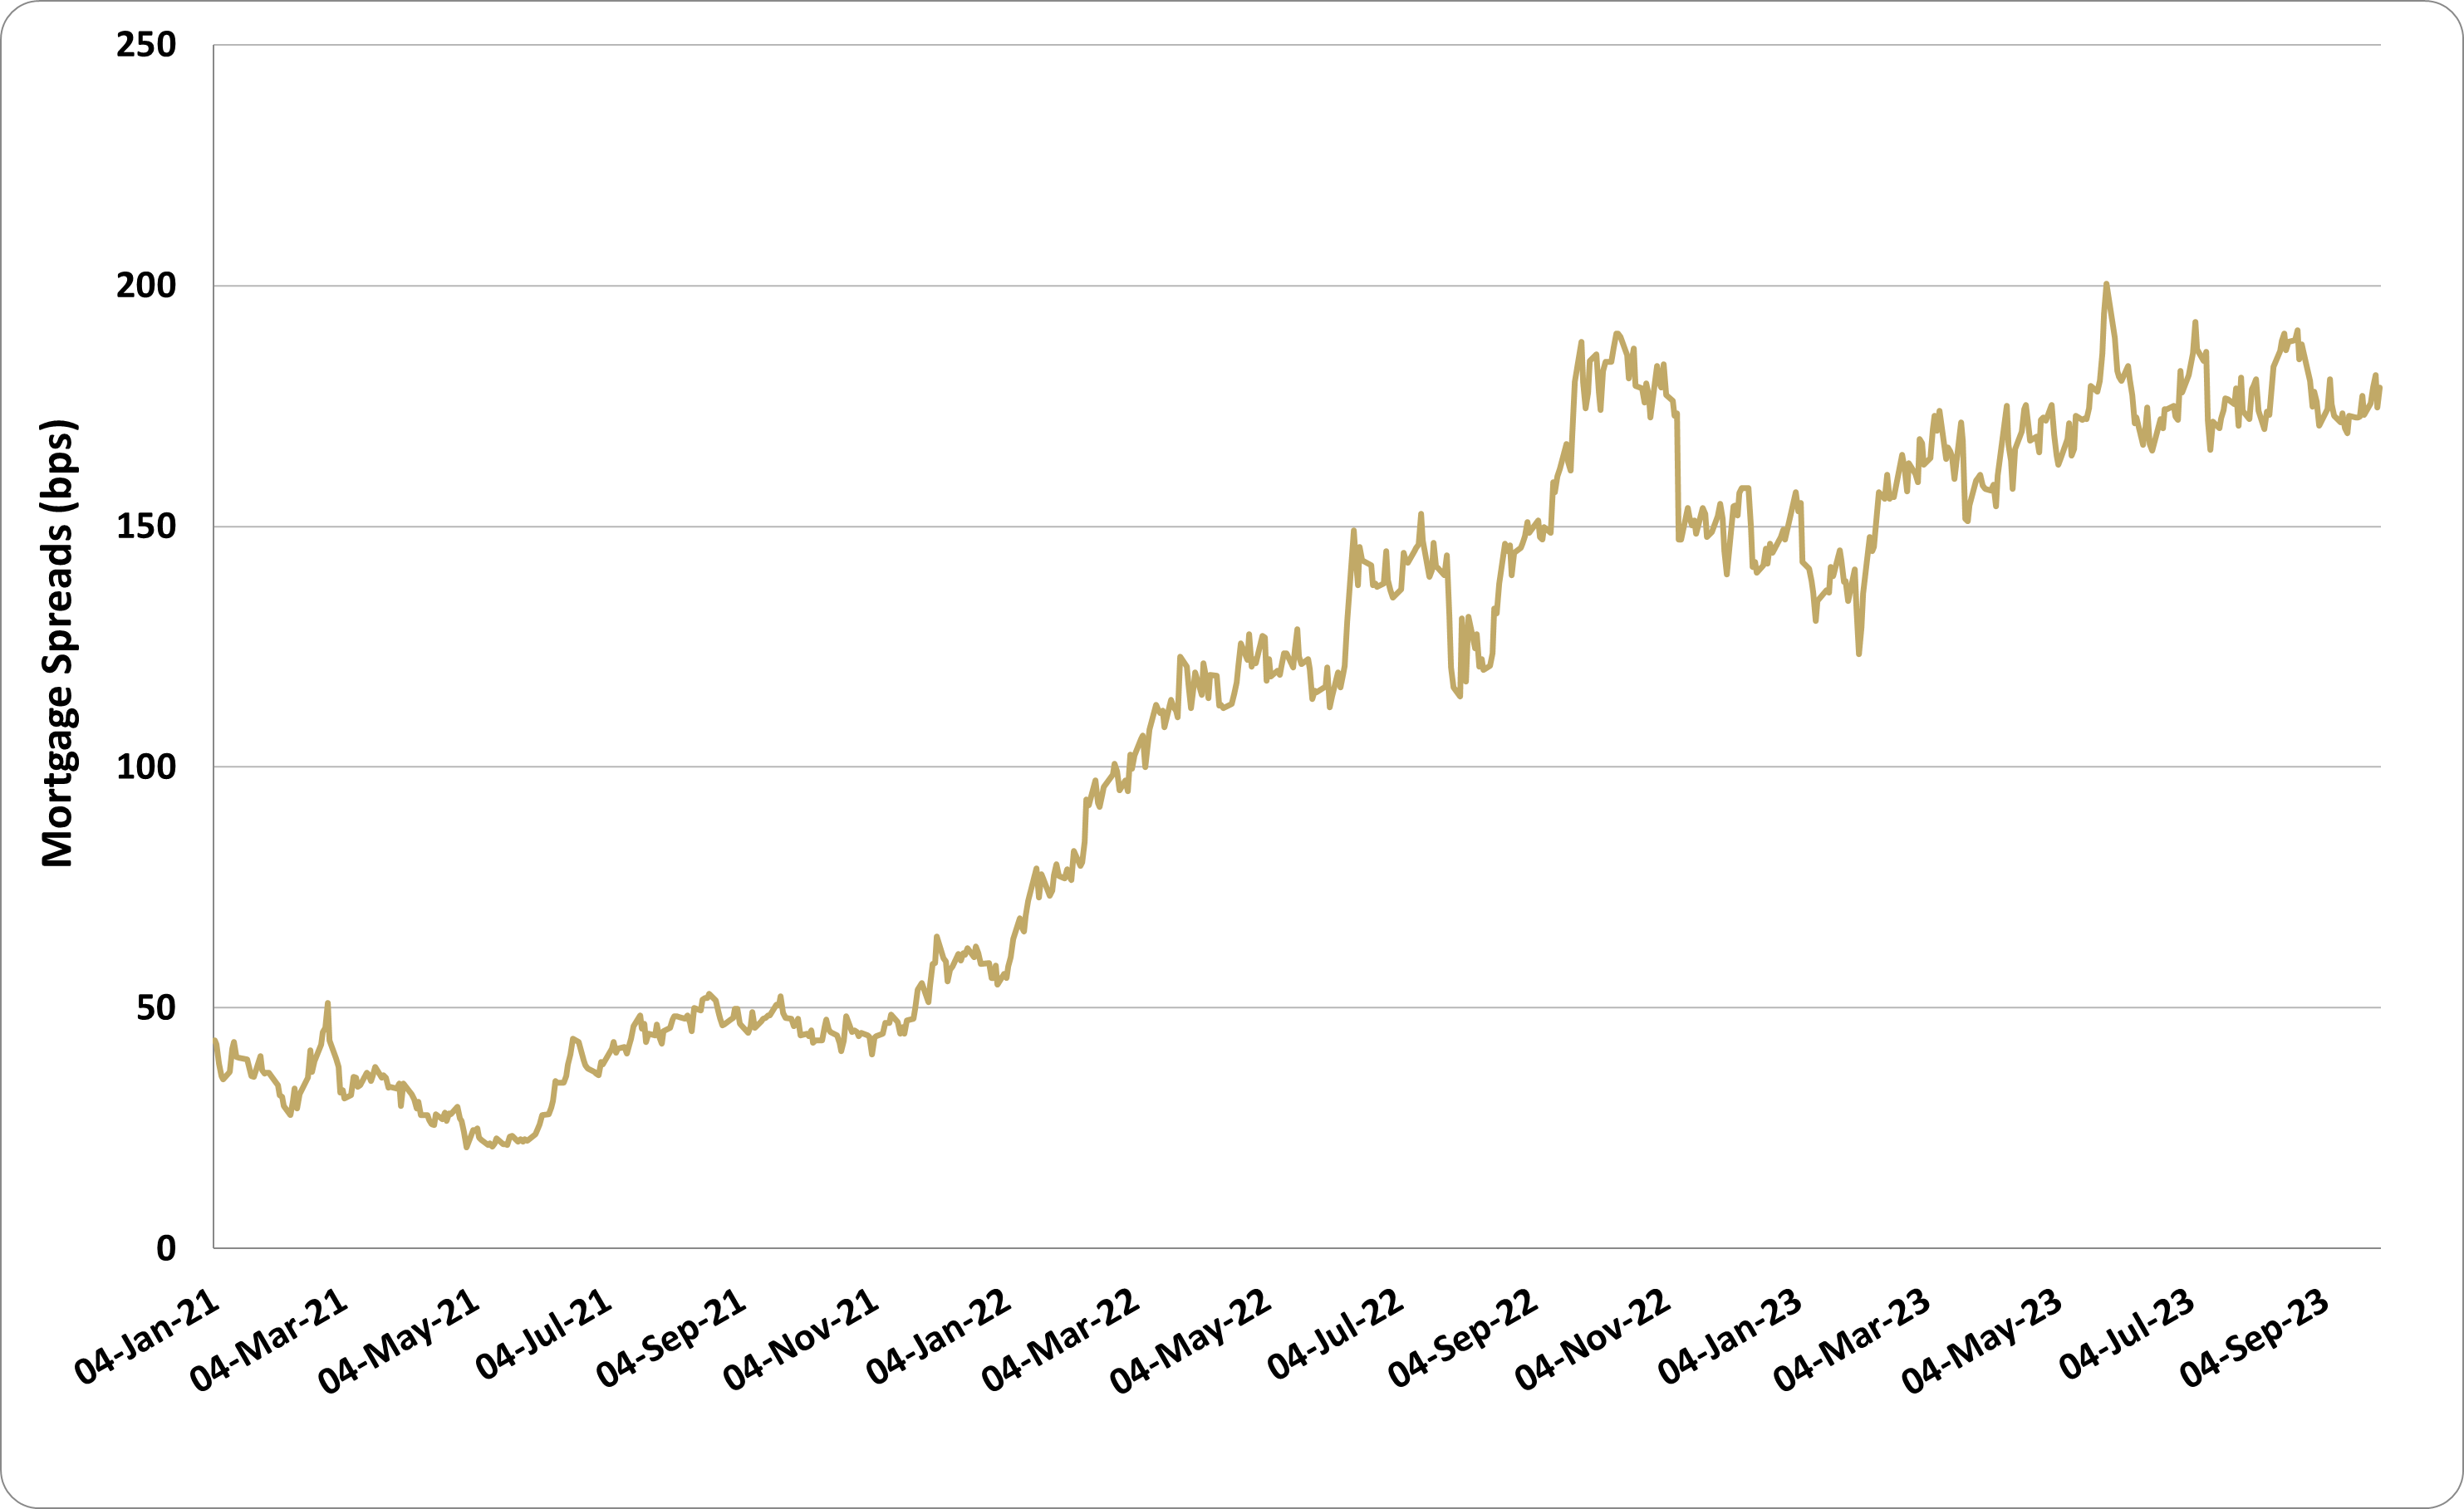
(2) Mortgage-Backed Securities (MBS)
Figure 4: MBS Yield Spreads
Step 2
This step has 3 components:
a. Select the most attractive point on the Treasury yield curve
b. Size the position to meet the fund’s duration target
c. Manage the cash collateral to maximize yield
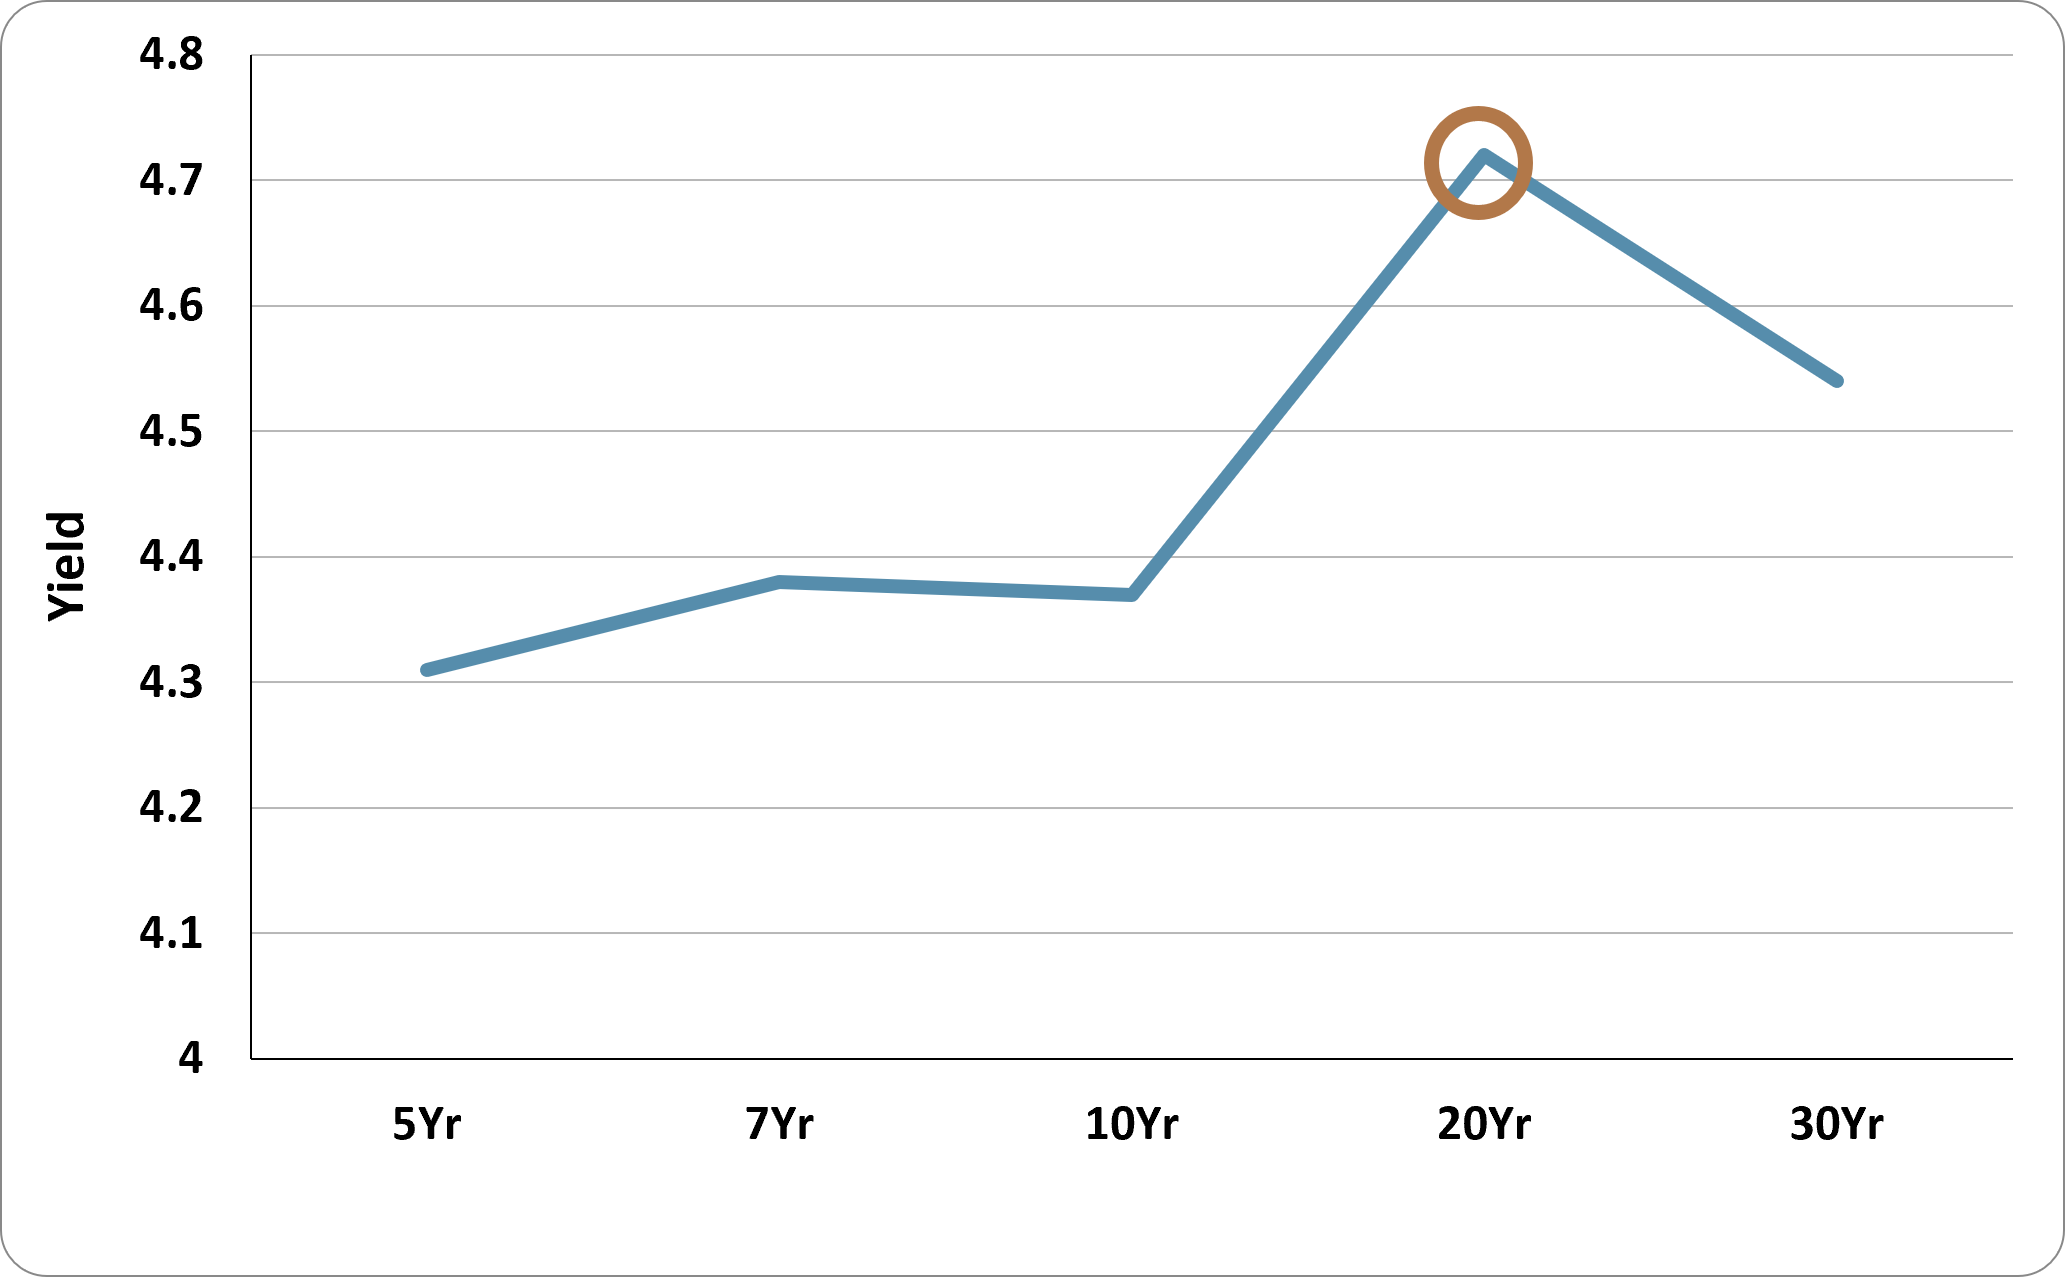
As of November 30, 2023, the most attractive point on the Treasury yield curve is 20 years (see Figure 5), which has higher yields than other points on the curve, as well as attractive carry characteristics.
In this example, the fund would favor this portion of the curve while sizing it to an amount that — when combined with the fund’s other holdings — achieves the fund’s target duration.
An important step in managing the Treasury futures exposure is optimizing the cash collateral. AGGH will seek the highest yielding short-term instruments that can be found without taking on credit risk.
Step 3
Investors are probably most familiar with options selling strategies for equities in the form of covered call funds. In fact, the largest actively managed ETF in the industry is an equity covered call fund. The obvious appeal of these funds is the distribution yields that are significantly higher than most traditional equity funds.
However, the drawback of these funds is that selling calls against the fund positions caps a fund’s potential gains. Since the majority of equity returns over time comes from capital appreciation, selling covered calls will lead to underperformance versus the underlying benchmark, even after taking in considerable option premiums.
In Figure 6, we see the total returns over the past decade of the CBOE S&P 500 Buy Write Index (an index representing a covered call strategy on the S&P 500 Index) versus the S&P 500 Index. Over the past 10 years, the covered call index has significantly trailed its underlying benchmark.
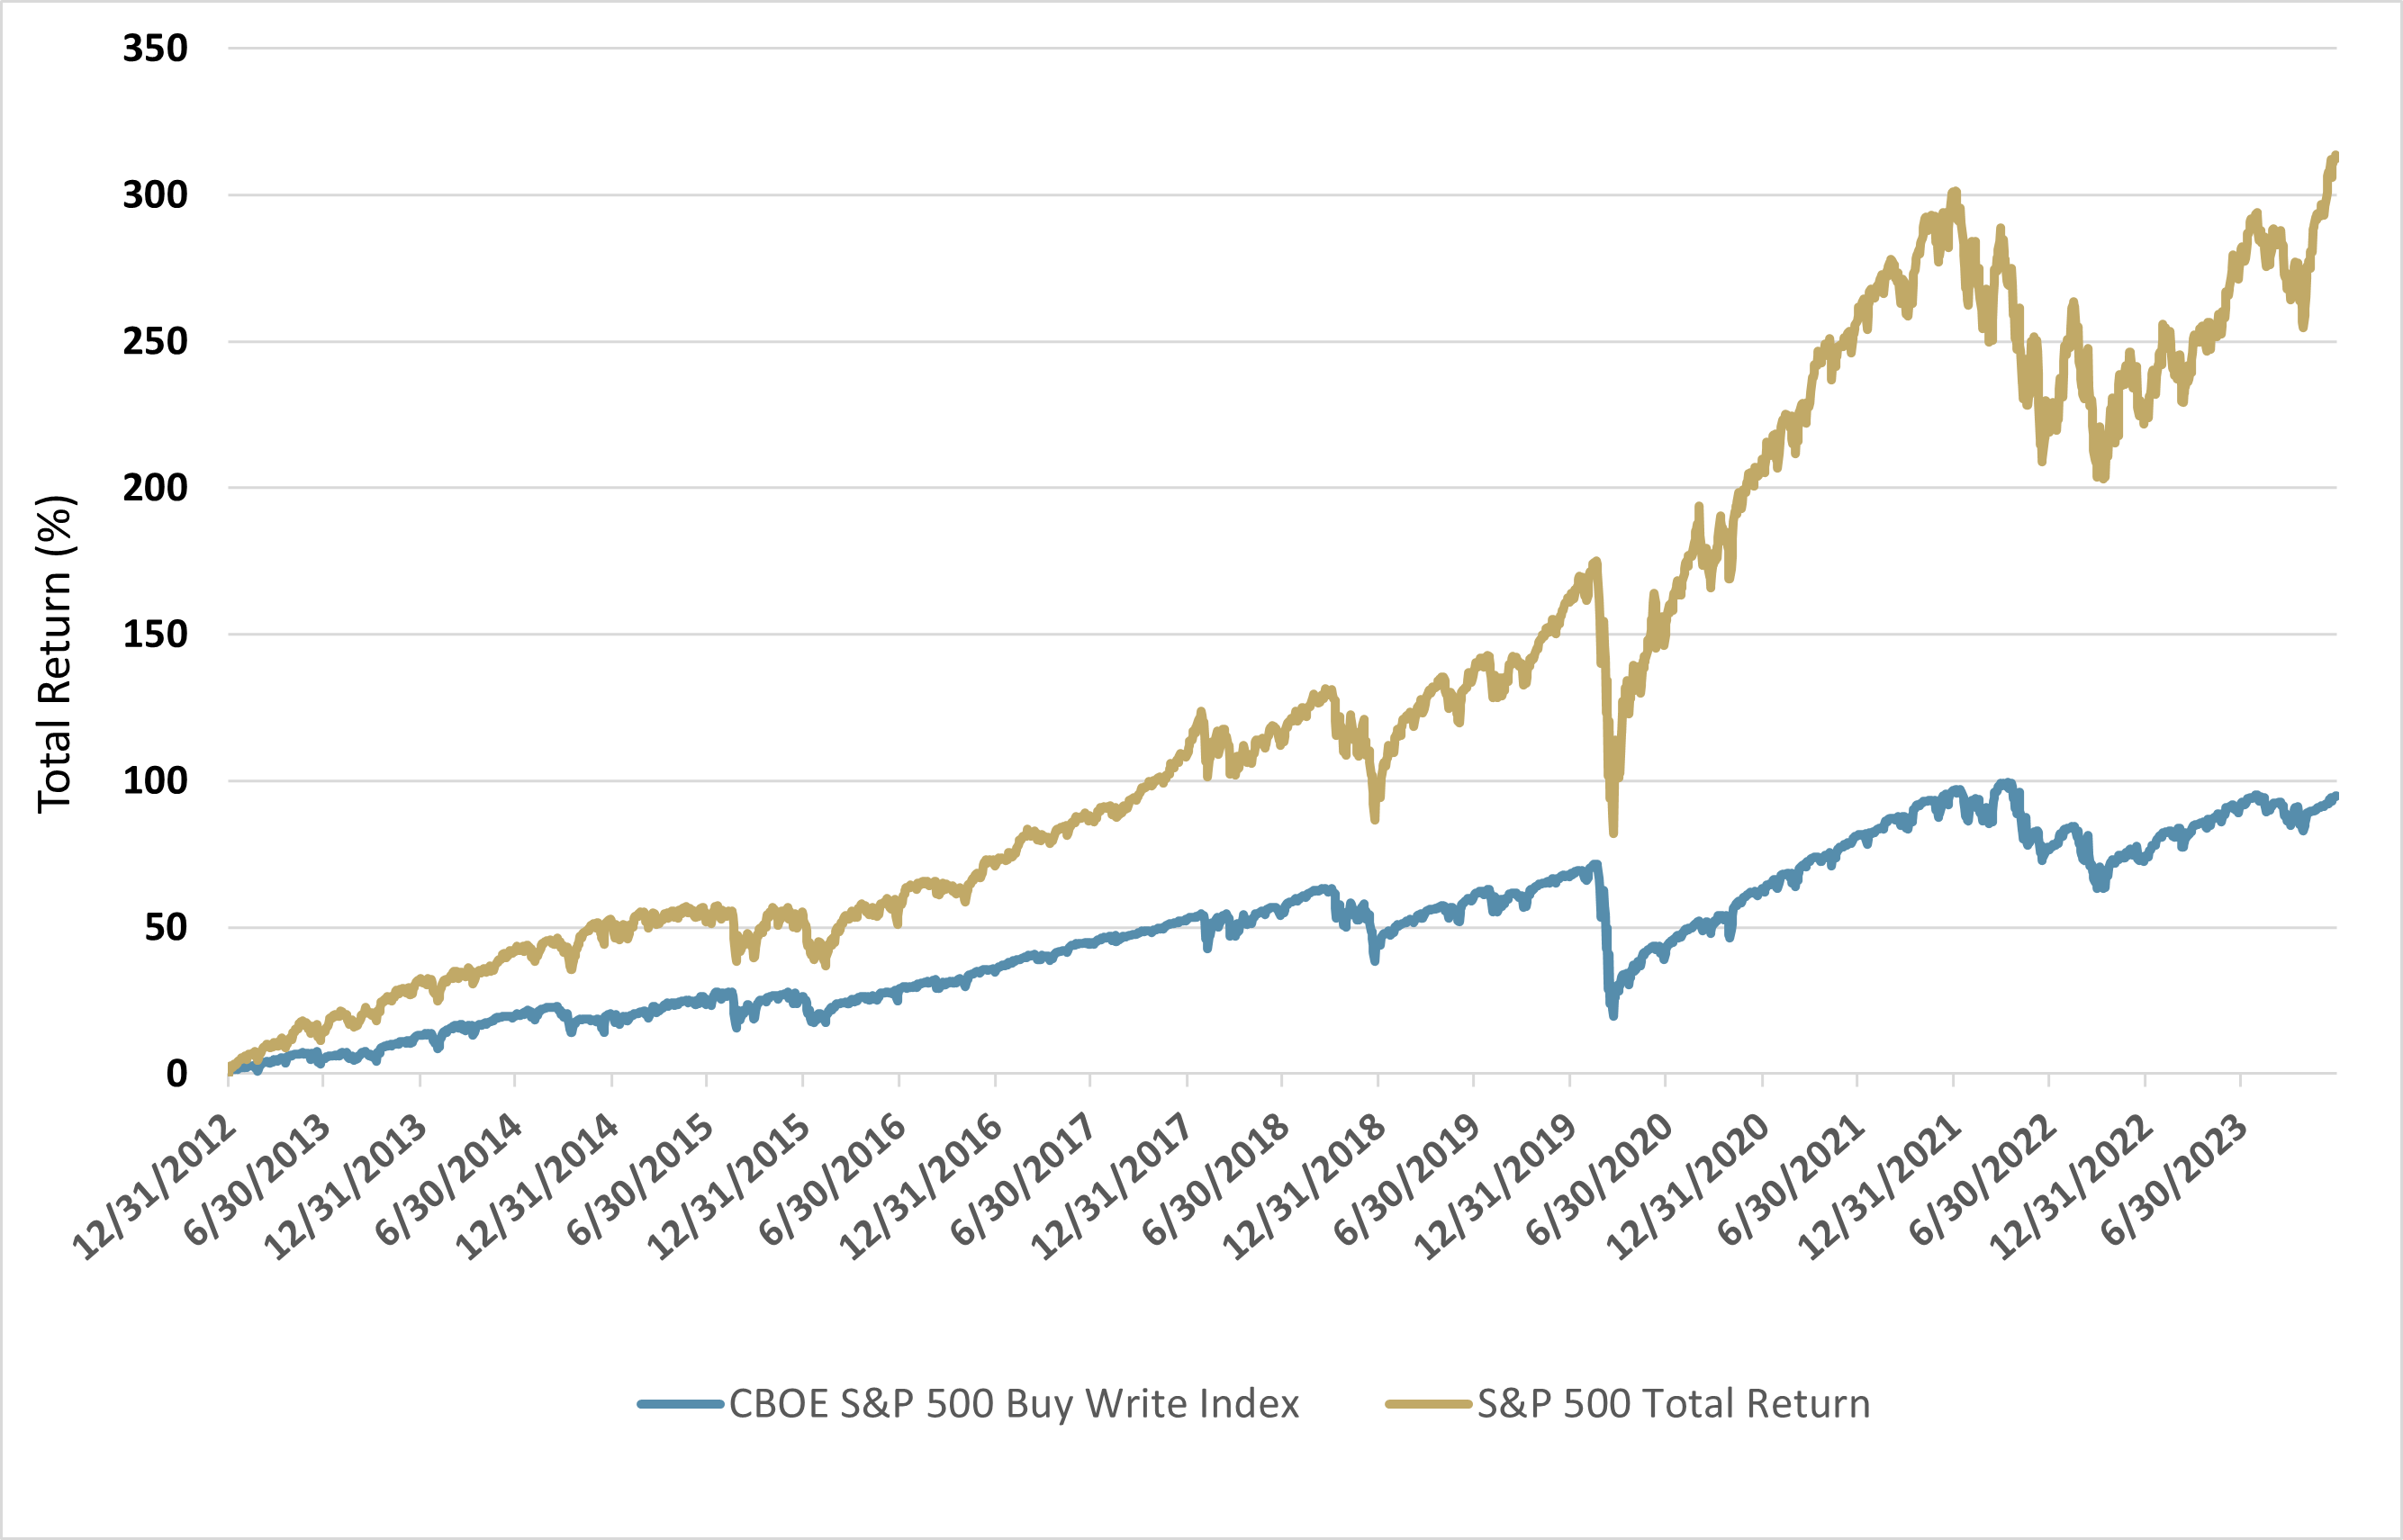
Past performance is not a guarantee of future results.
On the other hand, the majority of the returns from fixed income come from coupon payments, not capital appreciation. Selling calls against fixed income positions is much less likely to impede performance versus the benchmark. In fact, there is a structural opportunity in selling interest rate options versus equity options.
On the equity side, there is high structural demand to sell call options, driven by the massive flows into equity covered call strategies. On the interest rate side, there is high structural demand to buy call options, mostly driven by dealer hedging. Selling options on the fixed income side can thus be structurally advantageous in comparison to selling options on equities.
Now let’s run through a hypothetical example of AGGH's options selling strategy.
2. A price target is identified for the ETF over the next month or two based on fundamental analysis, and call options are sold with a strike price at the target. The strike price would typically be out-of-the- money to allow room for capital appreciation. Selling the option not only provides income, but also provides an exit at the target price.
- If the option expires with the ETF price below the strike price, then it is a “win”, as the fund keeps 100% of the option premium. The fund can then sell another option for even more income.
- If the ETF increases in price and hits the strike price, it’s also a win, as (a) the fund has earned option premium and (b) the fund exits the position at the desired price. The assets can then be redeployed into a new position with attractive risk-adjusted yield and repeat the process.
3. In addition to selling call options, the fund might also sell out-of-the-money put options. This also provides option income. In addition, it ensures that the fund will purchase more shares should they become available at even more attractive prices.
The goal of the strategy is to provide not only a significantly higher distribution yield than the underlying index, but a higher total return as well.
AGGH Use Cases
Many investors are comfortable holding the Aggregate Bond Index as their sole fixed income position due to its diversification and high credit quality. As a core bond fund with similar duration and credit characteristics as the Aggregate Bond Index, AGGH has two simple use cases:- As a complement to an investor’s other fixed income holdings with a goal of increasing yield and total return.
- As an investor’s sole fixed income position. For an investor holding a typical 60/40 portfolio, it is reasonable to use AGGH as the only fund representing the “40”.
Summary
While interest rates have risen across the board over the past few years, they remain relatively modest. As of December, 2023, bond index funds maintain distribution yields barely above 3%.Against this backdrop, AGGH has the opportunity to deliver significantly higher yields without taking on any additional duration or credit risk.
Portfolio Manager: Shailesh Gupta

Shailesh has over 20 years of investment management experience as a portfolio manager, trader and risk manager. His recent experience includes working as portfolio manager and trader at Anfield Capital, Commonwealth Opportunity Capital and Flint Rock Global Investors. Previously, Mr. Gupta worked at Pacific Investment Management Co. (PIMCO) for 10 years in various capacities including Head of Global Derivatives Trading and Strategy and co-managed portfolios dedicated to global fixed income with assets under management of over $60 billion. He was also in charge of Risk Management for PIMCO Europe during the financial crisis.
Shailesh holds Masters degrees in Financial Mathematics from University of Chicago and Behavioral Finance from UC Irvine. He also has an M.B.A. from Xavier School of Management, India and undergraduate degree in Engineering from Indian Institute of Technology, New Delhi. In his free time Shailesh practices to win Bridge Tournaments; he led his team to reach the Semi Finals of the nationals in 2019.
Glossary
Covered Call: A financial transaction in which the investor selling call options owns an equivalent amount of the underlying security.Duration: A measure of the sensitivity of the price of a bond or other debt instrument to a change in interest rates.
Mortgage-Backed Securities (MBS): Investment products similar to bonds. Each MBS consists of a bundle of home loans and other real estate debt bought from the banks that issued them. Investors in mortgage-backed securities receive periodic payments similar to bond coupon payments.
Out of the Money: An option has no intrinsic value, only extrinsic or time value.
Treasury Inflation-Protected Securities (TIPS): A type of Treasury security issued by the U.S. government. TIPS are indexed to inflation to protect investors from a decline in the purchasing power of their money.
Yield Spread: A difference between the quoted rate of return on different debt instruments which often have varying maturities, credit ratings, and risk.