Macroeconomic data has turned squarely positive in recent months. Inflation surprised to the upside in April for the third straight month, reaching 3.5% for the first time since September 2023. Joining inflation, non-farm payroll, manufacturing production, and GDP all surprised to the upside, while unemployment surprised to the downside (indicative of a hotter-than-expected labor market). In response, the Fed’s tone has changed dramatically – so much so that some members, such as Raphael Bostic, are open to additional rate hikes. Consensus is now for only a single rate cut in 2024, down from six expected rate cuts back in January. If economic data continues to come in hotter than expected, we do not believe the Fed will be in a hurry to cut interest rates.
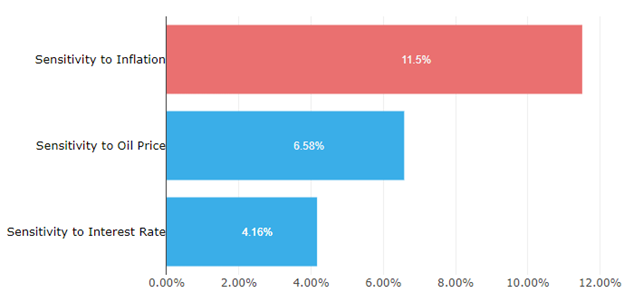
Focusing first on systematic equity investing, macro sensitivity factors led gains again this month (see Figure 1). Sensitivity to Inflation gained 11.5% as inflation increased from 3.2% at the March reading to 3.5% at the April reading. Sensitivity to Oil increased as geopolitical risk in the Middle East increased to its highest level since October 2023, and Sensitivity to Interest Rates rose on fresh hawkishness from the Fed. As expected, most Growth factors lost this month, while the majority of Value factors gained as the consensus first rate cut was further pushed back to September. FY2 Sales Growth led the losses for Growth factors, while yield style factors led the gains among Value.
Figure 1: Macro Sensitivity Factors Led Gains This Month
(Returns Mar 19 - Apr 19)Source: Wolfe Research
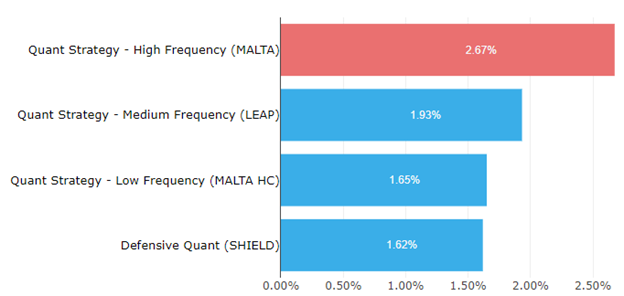
Quant factors (see Figure 2) also performed well in the past month, led by High Frequency Quant which was able to move quickly and adjust as the tone coming from the Fed changed. The surprises in macroeconomic data and change from dovishness to hawkishness from the Fed caught many sell-side analysts by surprise, and Analyst Sentiment type factors struggled as a result: only 1M Growth Diffusion saw positive returns last month, while 3M NTM Cash Flow Revisions saw the most negative returns.
Figure 2: Quant Factors Also Have a Strong Month
(Returns Mar 19 - Apr 19)
Source: Wolfe Research
Shifting now to managed futures, Societe Generale reported that their CTA index is up 11.48%, and the Trend-Following sub-index is up 13.88%, as of the 19th of April 2024. In the same period, the S&P 500 is up only 4.58%. The difference is especially stark in April, where the CTA Index is up 1.65% (as of the 19th) and the S&P 500 is down -5.21%.
Several factors have weighed on stock indexes in April. ‘Powell signaled this week that policymakers will wait longer than previously anticipated to cut rates following a series of surprisingly high inflation readings. Higher interests may reduce corporate earnings by lowering customer spending power and increasing payments on borrowing. Bloomberg further noted that the equity risk premium on the S&P 500 is ‘now deep in the negative territory’. This means that the yield derived from recent corporate earnings and dividends is less than the yield on US Bonds, so investors are not compensated for the higher price volatility associated with holding stocks. Finally, we note that the stock sell-off has taken place against a backdrop of escalating tensions between Israel and Iran. Although the situation has calmed in recent days, while Israeli operations in Gaza continue, the risk of escalation is ever present.
Many of these factors, which have been so painful for stocks, have been a tailwind for CTAs. Gold has risen rapidly in 2024, continuing an upward trend, driven partially by tensions in the Middle East and Ukraine. Prices are also supported by robust buying by central banks and increased demand from Chinese consumers.
Much of the recent trend in Oil has been a result of geopolitical risk, as threats to flows from Russia and the Middle East have intensified. However, the growing global economy is a major driver too. Bloomberg estimates that ‘a demand binge has contributed $15 to oil prices this year’, however, ‘supply abundance has subtracted $2 from oil prices since the beginning of 2024’.
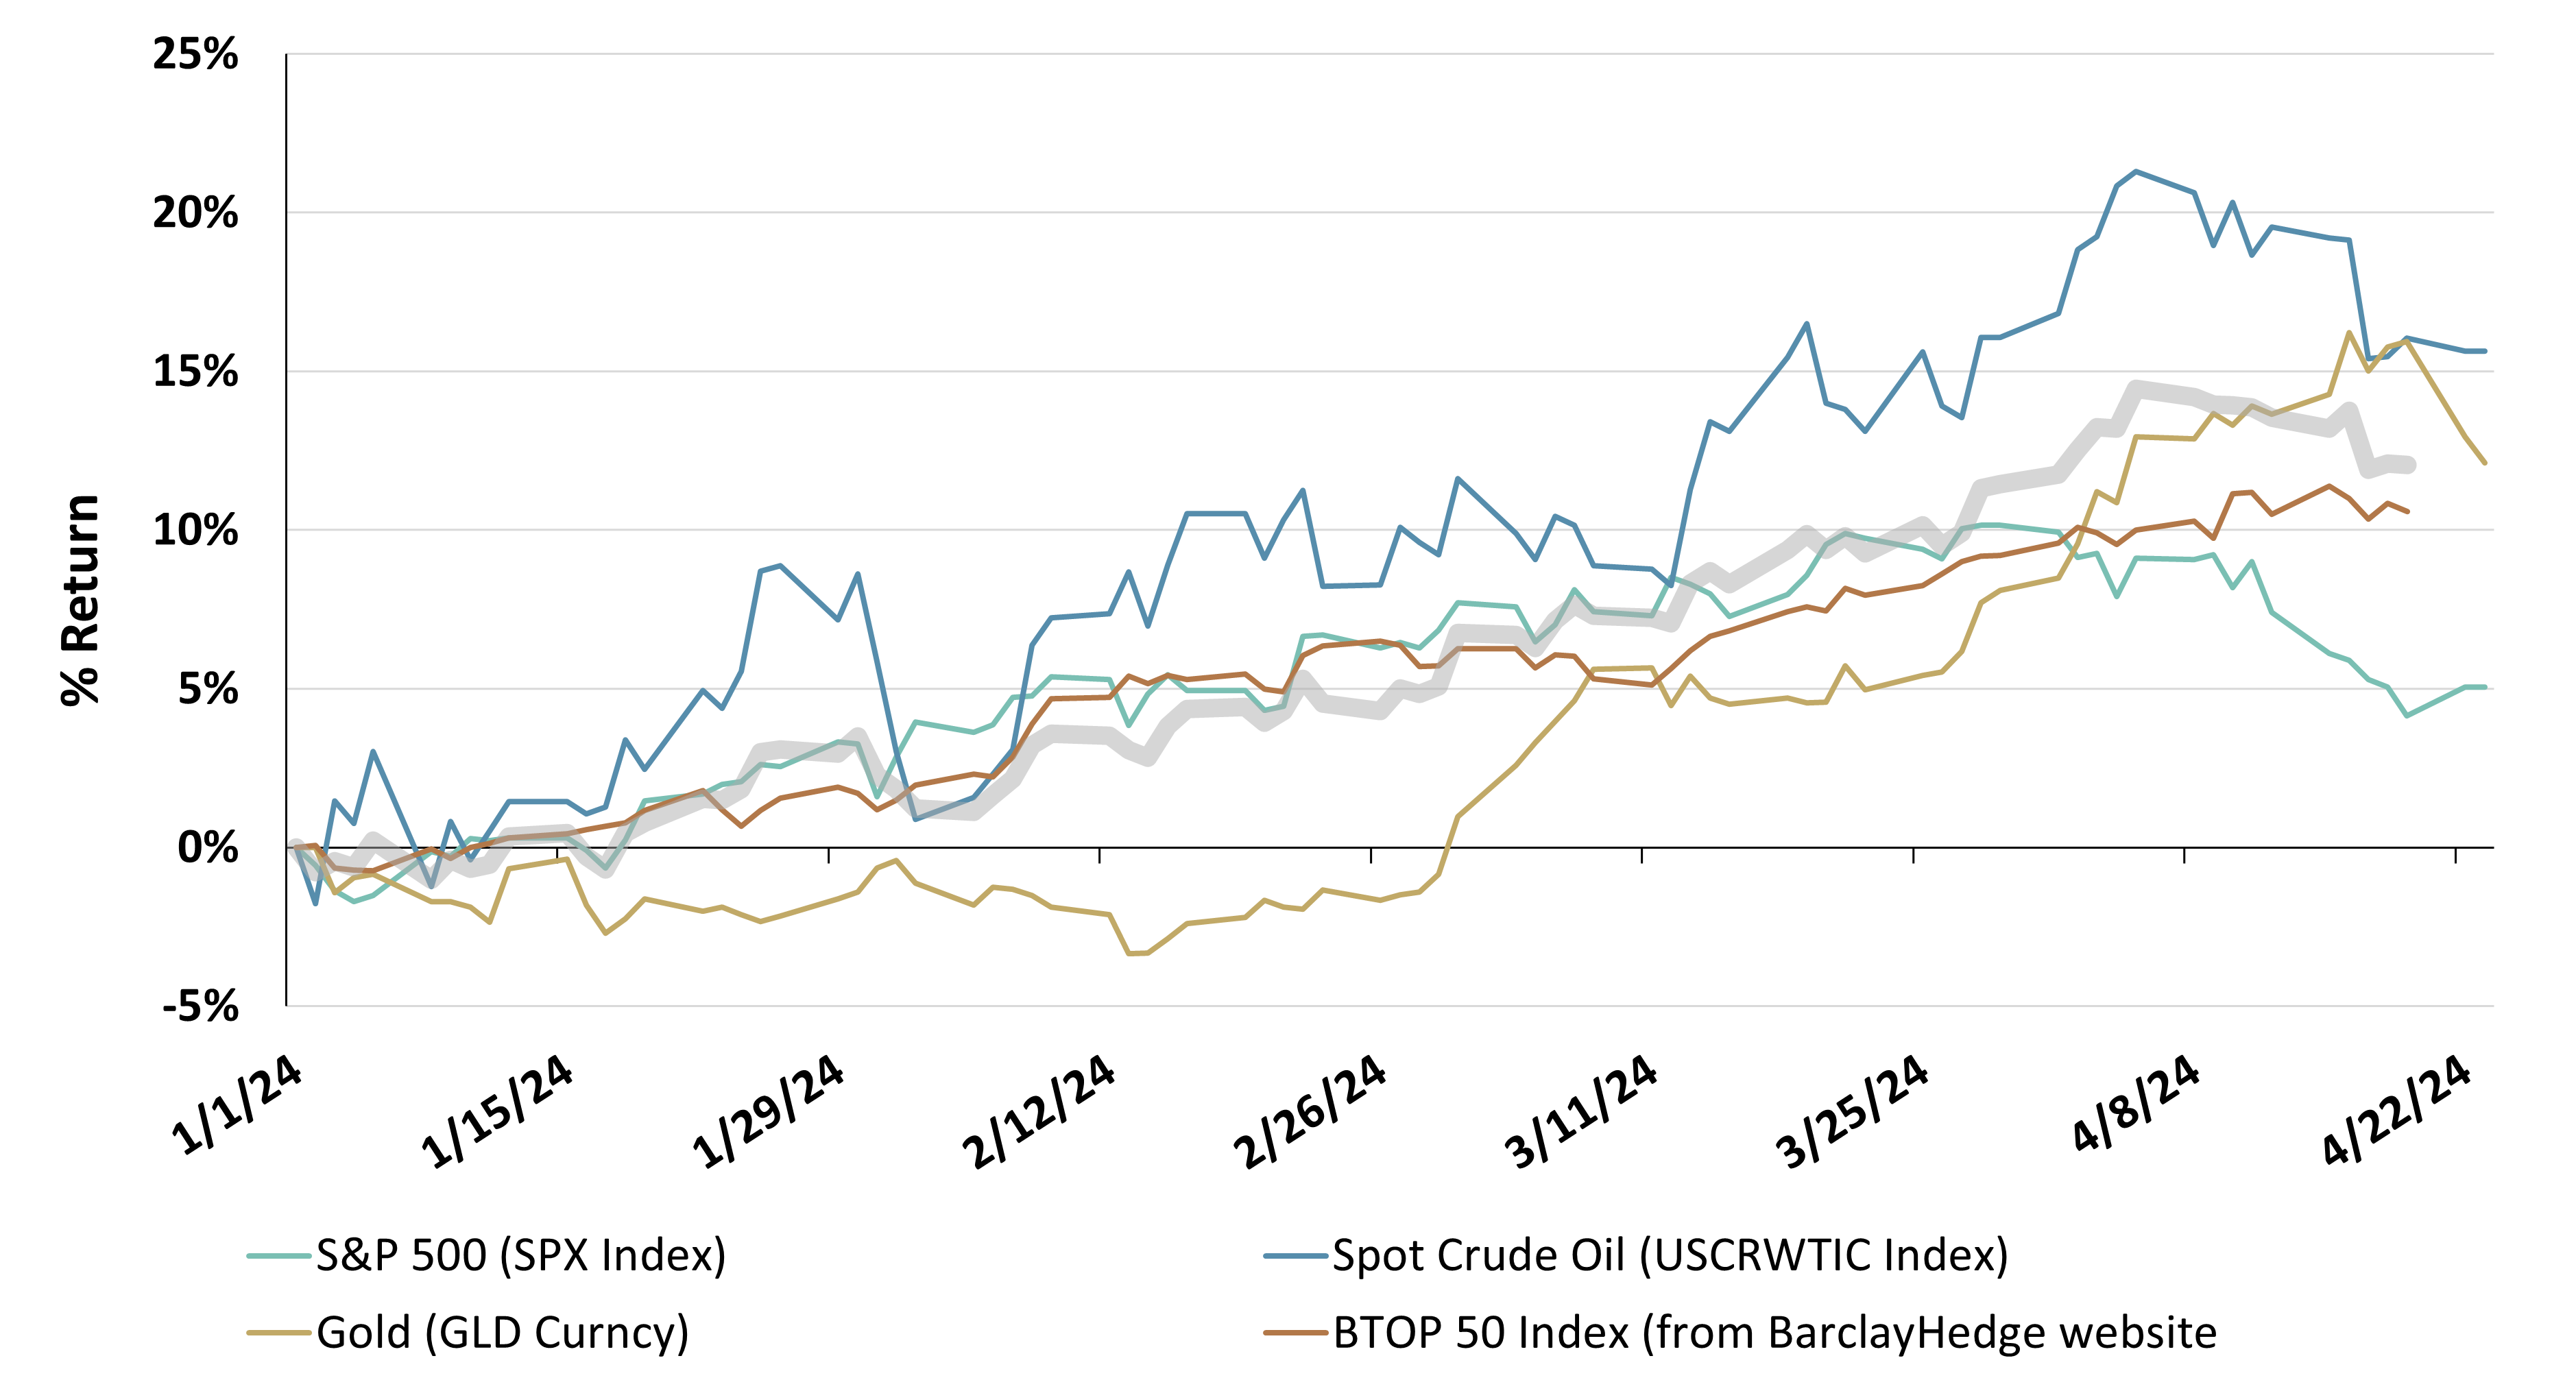
Figure 3 compares the year-to-date returns to the BTOP 50 CTA Index to Oil, Gold, and Stocks. It shows that CTA returns match the average of these three asset classes, however, CTA performance has been more robust in April. Potentially, this is because CTAs can use their futures trading experience to access niche markets. For example, they have benefitted from long positions in Cocoa. It has experienced an extremely strong rally this year, as bad weather and disease took its toll. Other diversifying trades included shorting Raw Sugar and Soybeans.
In summary, high valuations, geopolitical risk, and inflation are making investing a challenge in 2024. This appears to be creating an ideal hunting ground for trend-following CTAs. So far this year, they have delivered consistent returns, despite a volatile market environment.
Figure 3: BTOP50 CTA Index vs. Key CommoditiesSource: Altis Partners. The BarclayHedge BTOP50 CTA Index (red) compared to the S&P 500 (blue), Gold (yellow) and Crude Oil (black). BTOP 50 data was only available up to 2024-04-19 at the time of writing.
GLOSSARY:
Managed Futures: An investment where a portfolio of futures contracts is actively managed by professionals. Managed futures are considered an alternative investment and are often used by funds and institutional investors to provide both portfolio and market diversification.
Register for Simplify's Investor Hub
In-depth case studies provide valuable insights into practical portfolio problems and their solutions
Simplify curated model portfolios that show investors how to incorporate alternatives into their portfolio
Stay up-to-date with our latest thoughts on markets via our weekly market commentaries