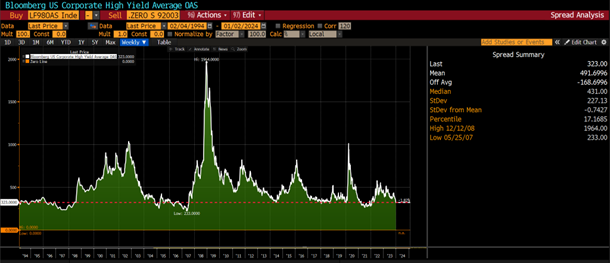
During the strong risk-on move in December, credit spreads have declined from a historically average 437bps to 323bps, the 17th percentile since 1994, and inside any period excluding the AIG-sponsored levels pre-2008 and the post-Covid liquidity peak in 2021 (see Figure 1). Our understanding is that this tightening has been driven by a systematic trend following strategies (colloquially “CTAs”) selling CDS to go synthetically long the credit markets. We have recently taken advantage of these tight CDS spreads in our funds. As we’ve noted, our primary credit hedging tool, a customized Quality-Junk overlay, has significantly outperformed expectations, and we’re using the recent tightness in CDS to begin diversifying our protection sources. As of January, roughly 20% of our credit hedging will be expressed in 5-year HY credit default swaps.
Figure 1: High Yield OAS
Source: Bloomberg
Issuance remained muted in December as credit markets closed down for the traditional end-of-year period. New issue ratings were less than half November levels. However, we’re likely to see significant new issuance into January as companies rush to take advantage of the lowest yields since August 2022.
As we have noted in prior write-ups, maturity walls are rapidly approaching, and many high yield issuers will be forced to issue to prevent paper financed in periods of low interest rates from being pushed into current liabilities, where ratings agencies tend to grow increasingly concerned. As a reminder, at 4.89 years, the weighted average maturity of the high yield credit market is the lowest in history.
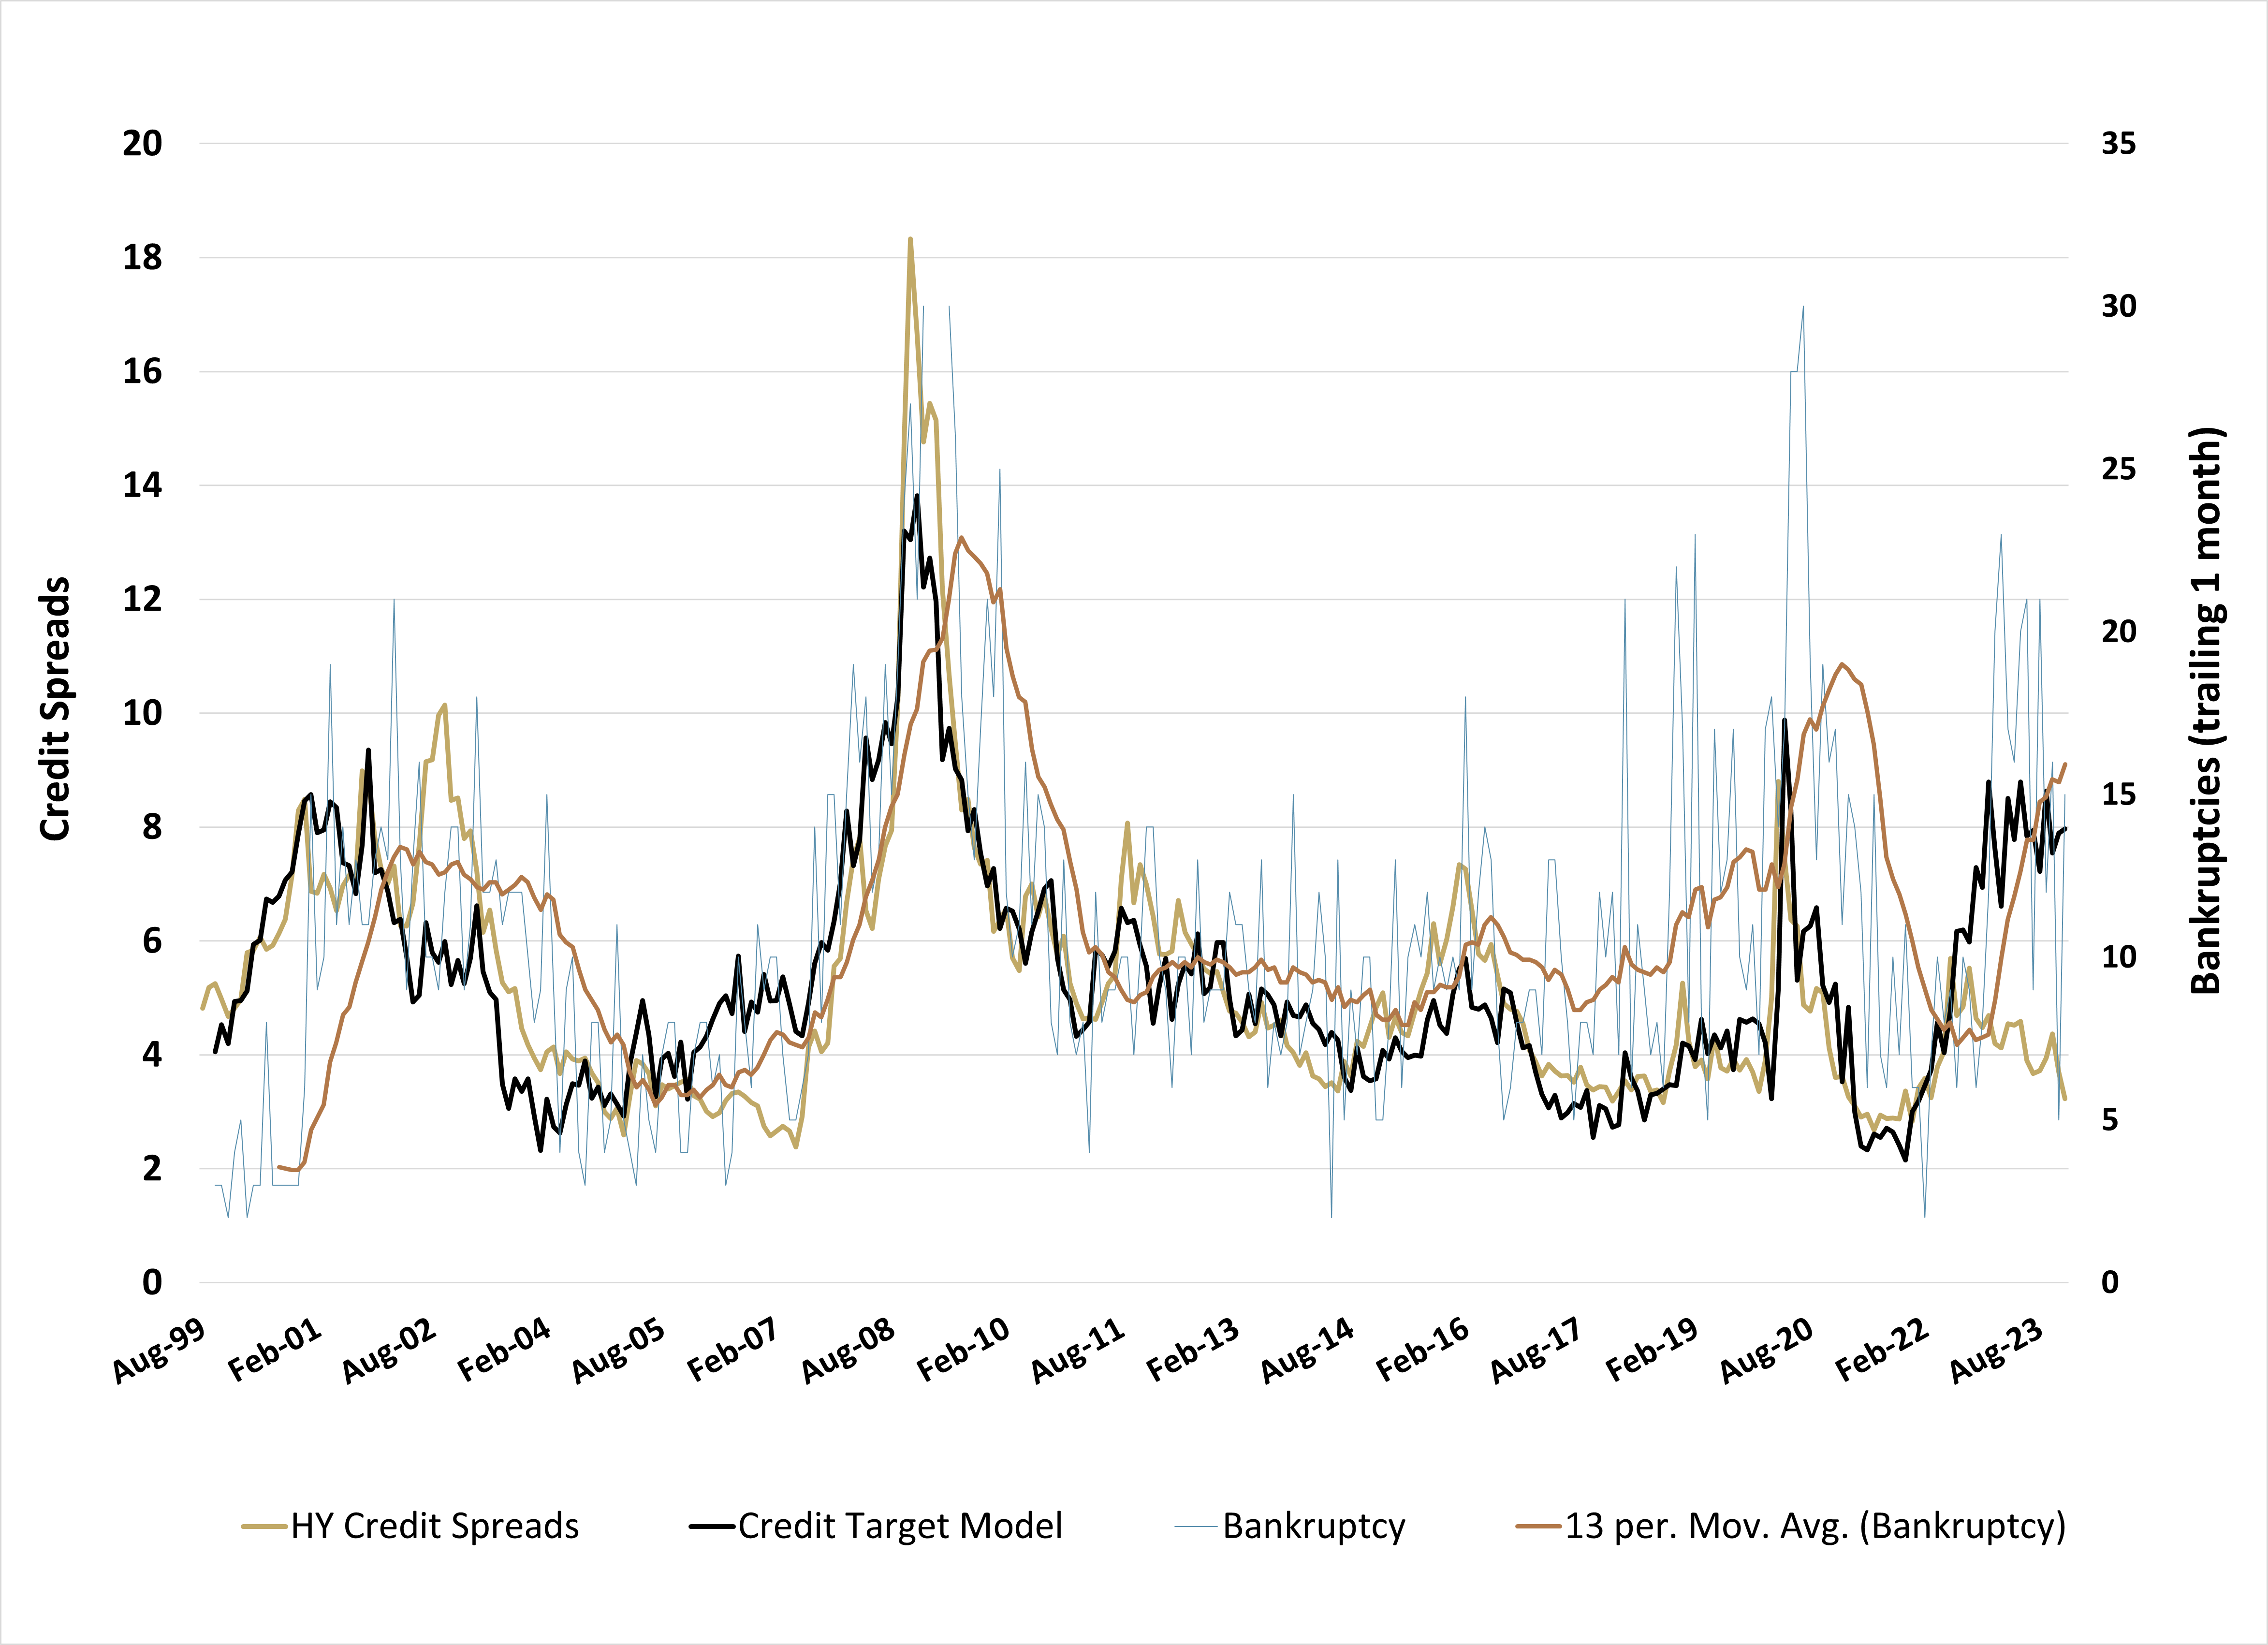
Our credit spread model (Figure 2) widened slightly last month as our fundamental inputs deteriorated. The primary driver was a reversal of last month’s improvement in the NY Fed’s Empire General Business Conditions, which fell back near the lowest levels of 2023. This pattern of unsustained improvement has been a characteristic of 2023. The model continues to suggest that high yield credit spreads sit at less than half of warranted levels. Similar divergences have preceded major credit events, and when alongside the Empire’s deterioration, we saw an additional surge in bankruptcies. We continue to be surprised by these levels of financial distress without a recession; to see credit spreads inside the cheapest 20th percentile since 1994 under these conditions is somewhat mystifying.
Figure 2: Credit Spread Model
Source: Bloomberg, Simplify Asset Management
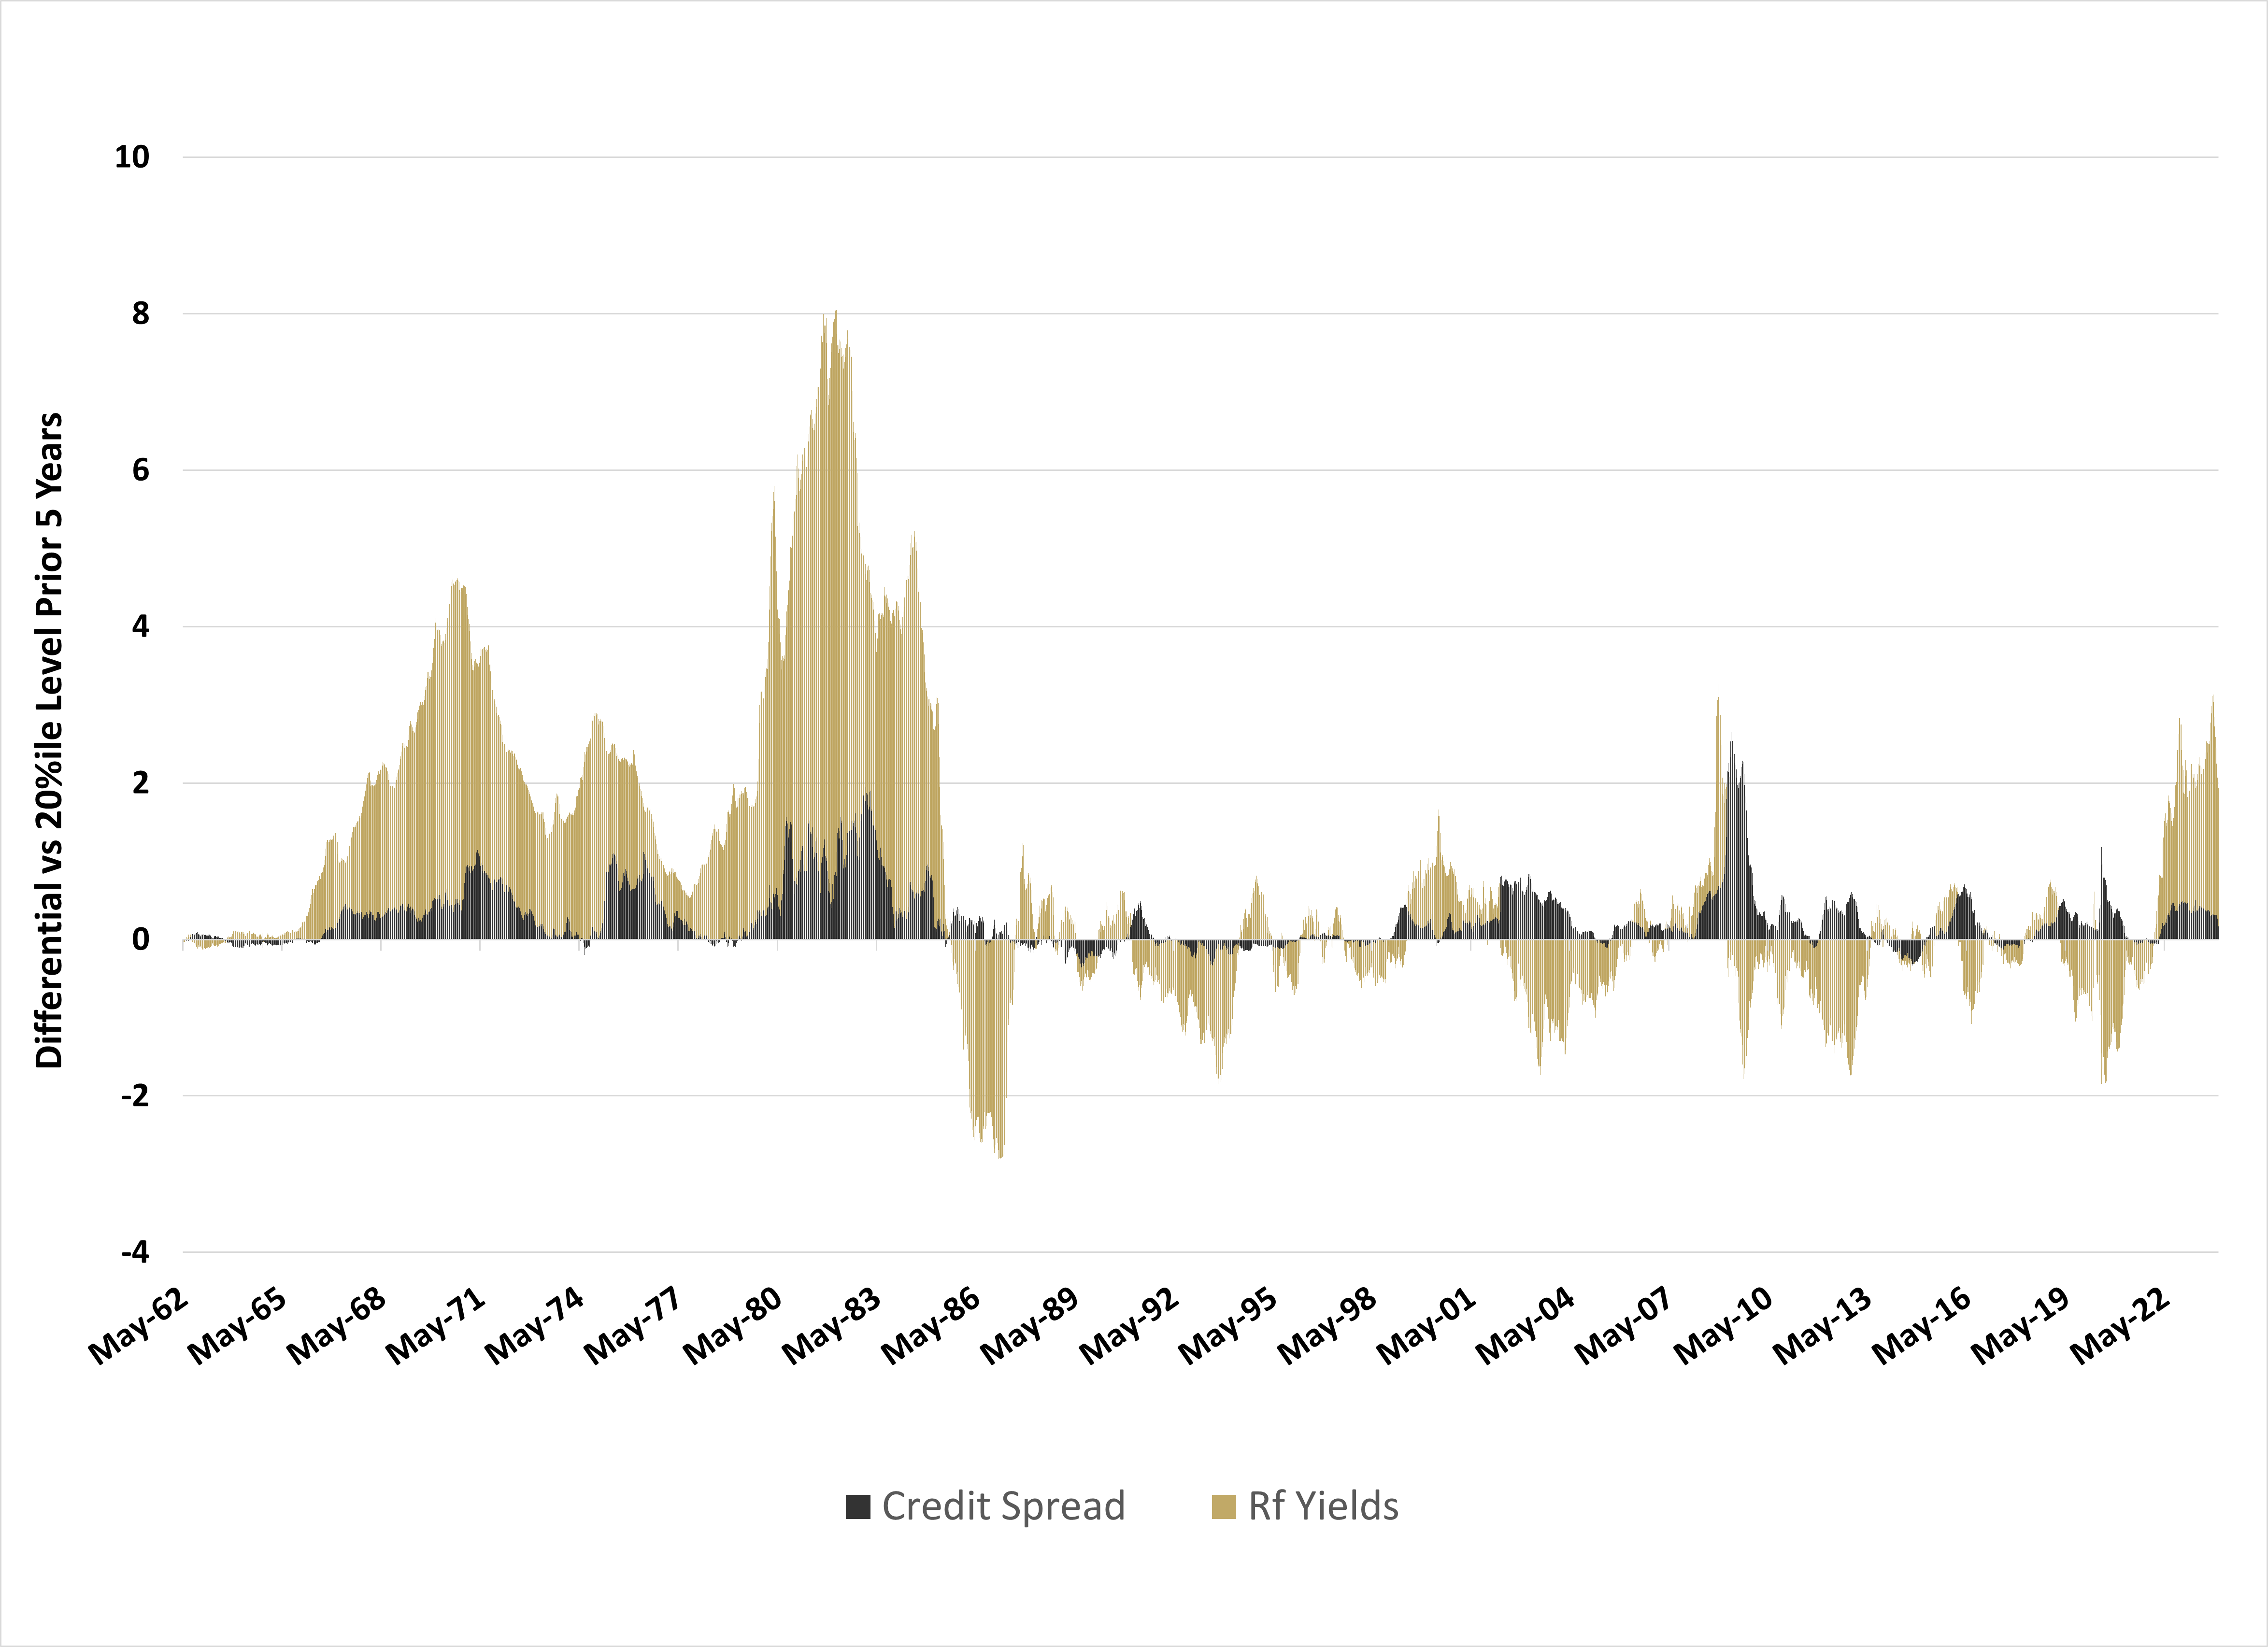
Last month we highlighted that the levels of risk-free interest rates represented the key risk to markets, and alongside the recent rally in risk assets, we indeed saw rates rally sharply. From our perspective, this is critical as prior credit cycles have almost always started with risk-free yield increases driving spreads. While this cycle remains muted versus the 1960-1980 transition, the rapid increase in interest rates and slowing nominal growth are combining to put credit at risk. With the notable exception of the Covid pandemic, all credit cycles begin as rates cycles (see Figure 3).
Figure 3: Rates vs. Credit Spreads
Source: Bloomberg, Simplify Asset Management
Register for Simplify's Investor Hub
In-depth case studies provide valuable insights into practical portfolio problems and their solutions
Simplify curated model portfolios that show investors how to incorporate alternatives into their portfolio
Stay up-to-date with our latest thoughts on markets via our weekly market commentaries