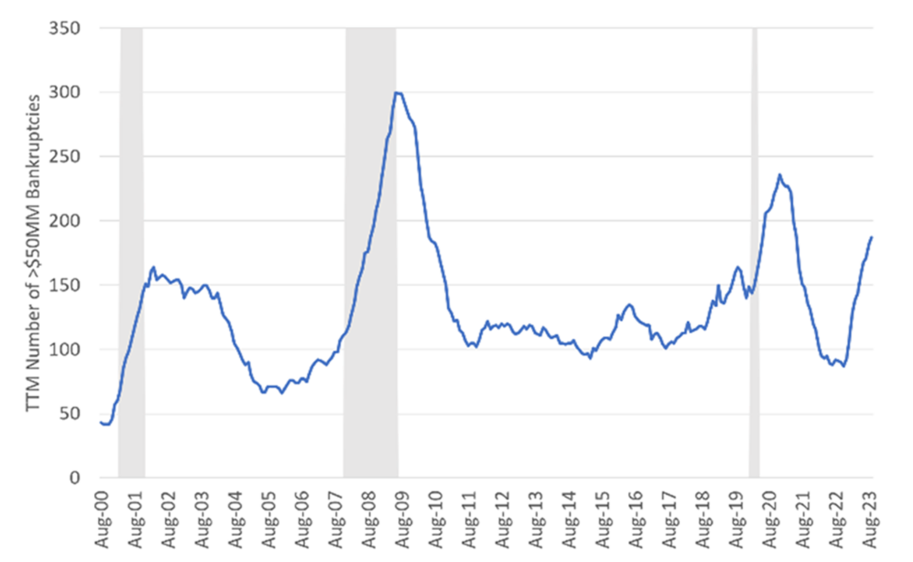
High yield credit spreads widened modestly in September, although the absolute level of credit spreads remained supportive of a soft landing. Unfortunately, realized bankruptcies continue to mount with fourteen more in September, taking the trailing twelve-month number of bankruptcies above $50MM in assets to 187 – by far the highest level ever achieved in a non-recessionary economy (Figure 1). A simple reminder that recessions are declared in hindsight, with only the 2020 recession being so “obvious” that it was declared in near real-time (and yet still after it was over).
Our credit spread model continues to suggest that high yield credit spreads sit at roughly half of warranted levels. Current levels as of September 30th were 394 basis points, versus our fair value model at 766 bps. The key issue appears to be the accelerating increase in “risk-free” government bond yields around the globe. Note this is not a US phenomenon, with interest rates accelerating upwards in the US, Europe and Japan. And these increases in yields are not being driven by fears of higher inflation, as inflation breakevens remain stable. As a result, there are only two possible sources of this increase:
A buyer strike driven by competing investment alternatives reducing demand for global risk-free bonds
An increase in bond issuance without a corresponding increase in demand as marginal capital flows are not responding to the increased opportunity set due to various factors (linked to reason #1)
As you might expect, we think it’s a combination of the two as higher interest rates do not necessarily invoke comparison shopping between risk-free bonds, credit investments like high yield, and equities (or private alternatives) in the modern “fixed allocation” model portfolio world. With few investors capable of rapid discretionary allocation changes across asset classes, money continues to ignore the dramatic change in both real and nominal risk-free interest rates.
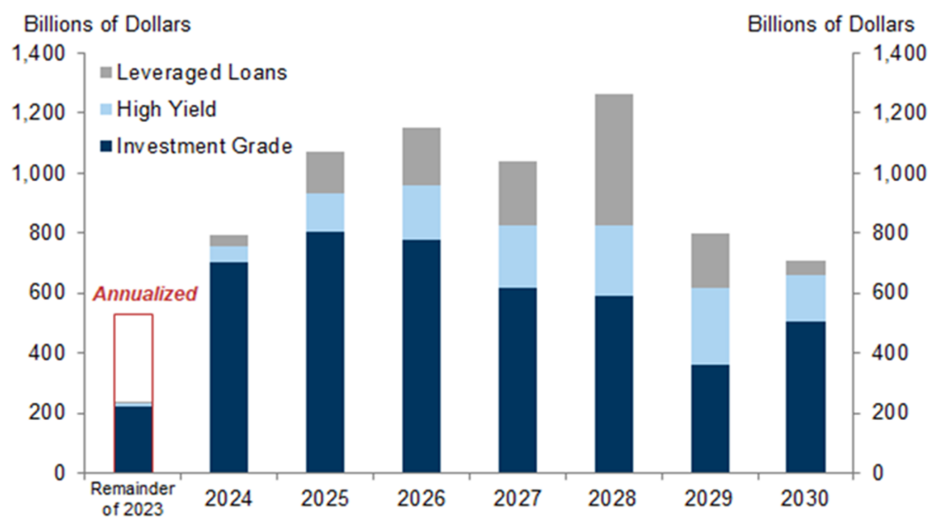
Corporations, however (like households in the real estate market), are not ignoring the change in the level of yields, with a nearly unprecedented issuance drought leading to collapsing weighted average maturity. Since our August update, weighted average maturity for high yield bonds has fallen by an additional 20 days to less than 4.95 years. As a reminder, after the flood of capital hit the market in 2021, the weighted average maturity was over 6.5 years. The maturity wall for high yield begins in earnest in 2024 (see Figure 2), with few signs that levered corporates are positioned to refinance successfully.
Figure 2: Maturity Timeline for Corporate DebtSource: Goldman Sachs
Register for Simplify's Investor Hub
In-depth case studies provide valuable insights into practical portfolio problems and their solutions
Simplify curated model portfolios that show investors how to incorporate alternatives into their portfolio
Stay up-to-date with our latest thoughts on markets via our weekly market commentaries