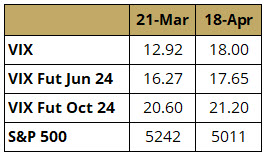
Since our last update, VIX has increased alongside the decline in the equity market. Notably, futures have moved up less, suggesting the market is expecting VIX to revert to the recent mean. Longer-dated VIX contracts continue to trade at a significant premium due to election uncertainty, as seen in Table 1.
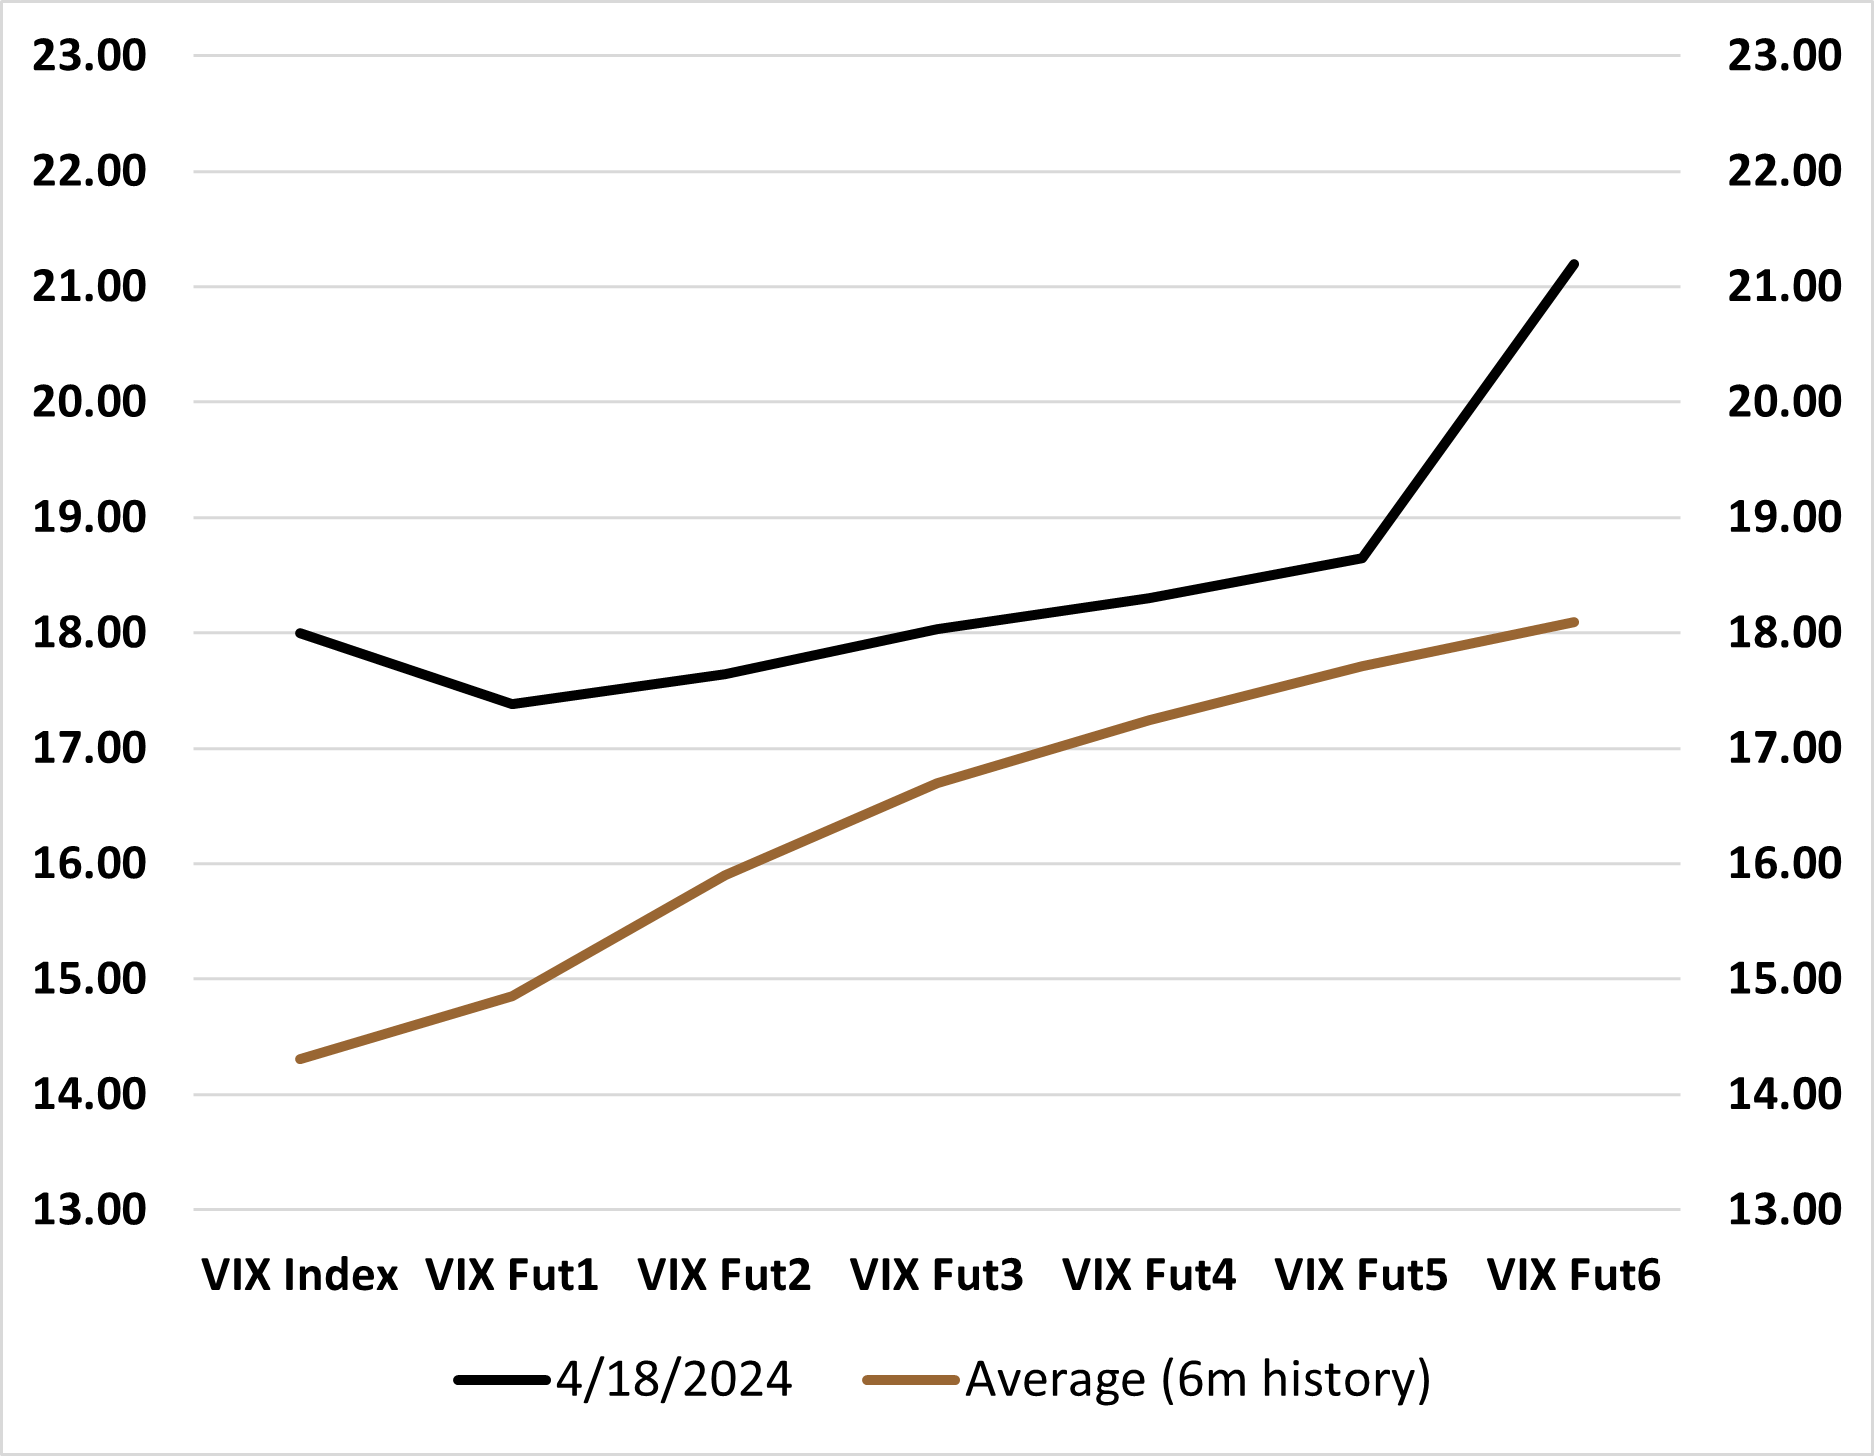
One of the main reasons for the drawdown in the equity market, and the consequent rise in VIX, has been higher rates. But in a high-rate environment, the FED has more room to cut rates and contain the risk of contagion in case of a crisis event, resulting in lower probabilities for a potential spike in VIX. If the VIX reverts to the recent mean with geo-political risks potentially subsiding, the front contracts would likely be the biggest beneficiaries, as evidenced by the shape of the curve in Figure 1. Longer-dated VIX futures could potentially remain high until election uncertainties have passed.
Figure 1: VIX Term StructureSource: Bloomberg, Simplify Asset Management
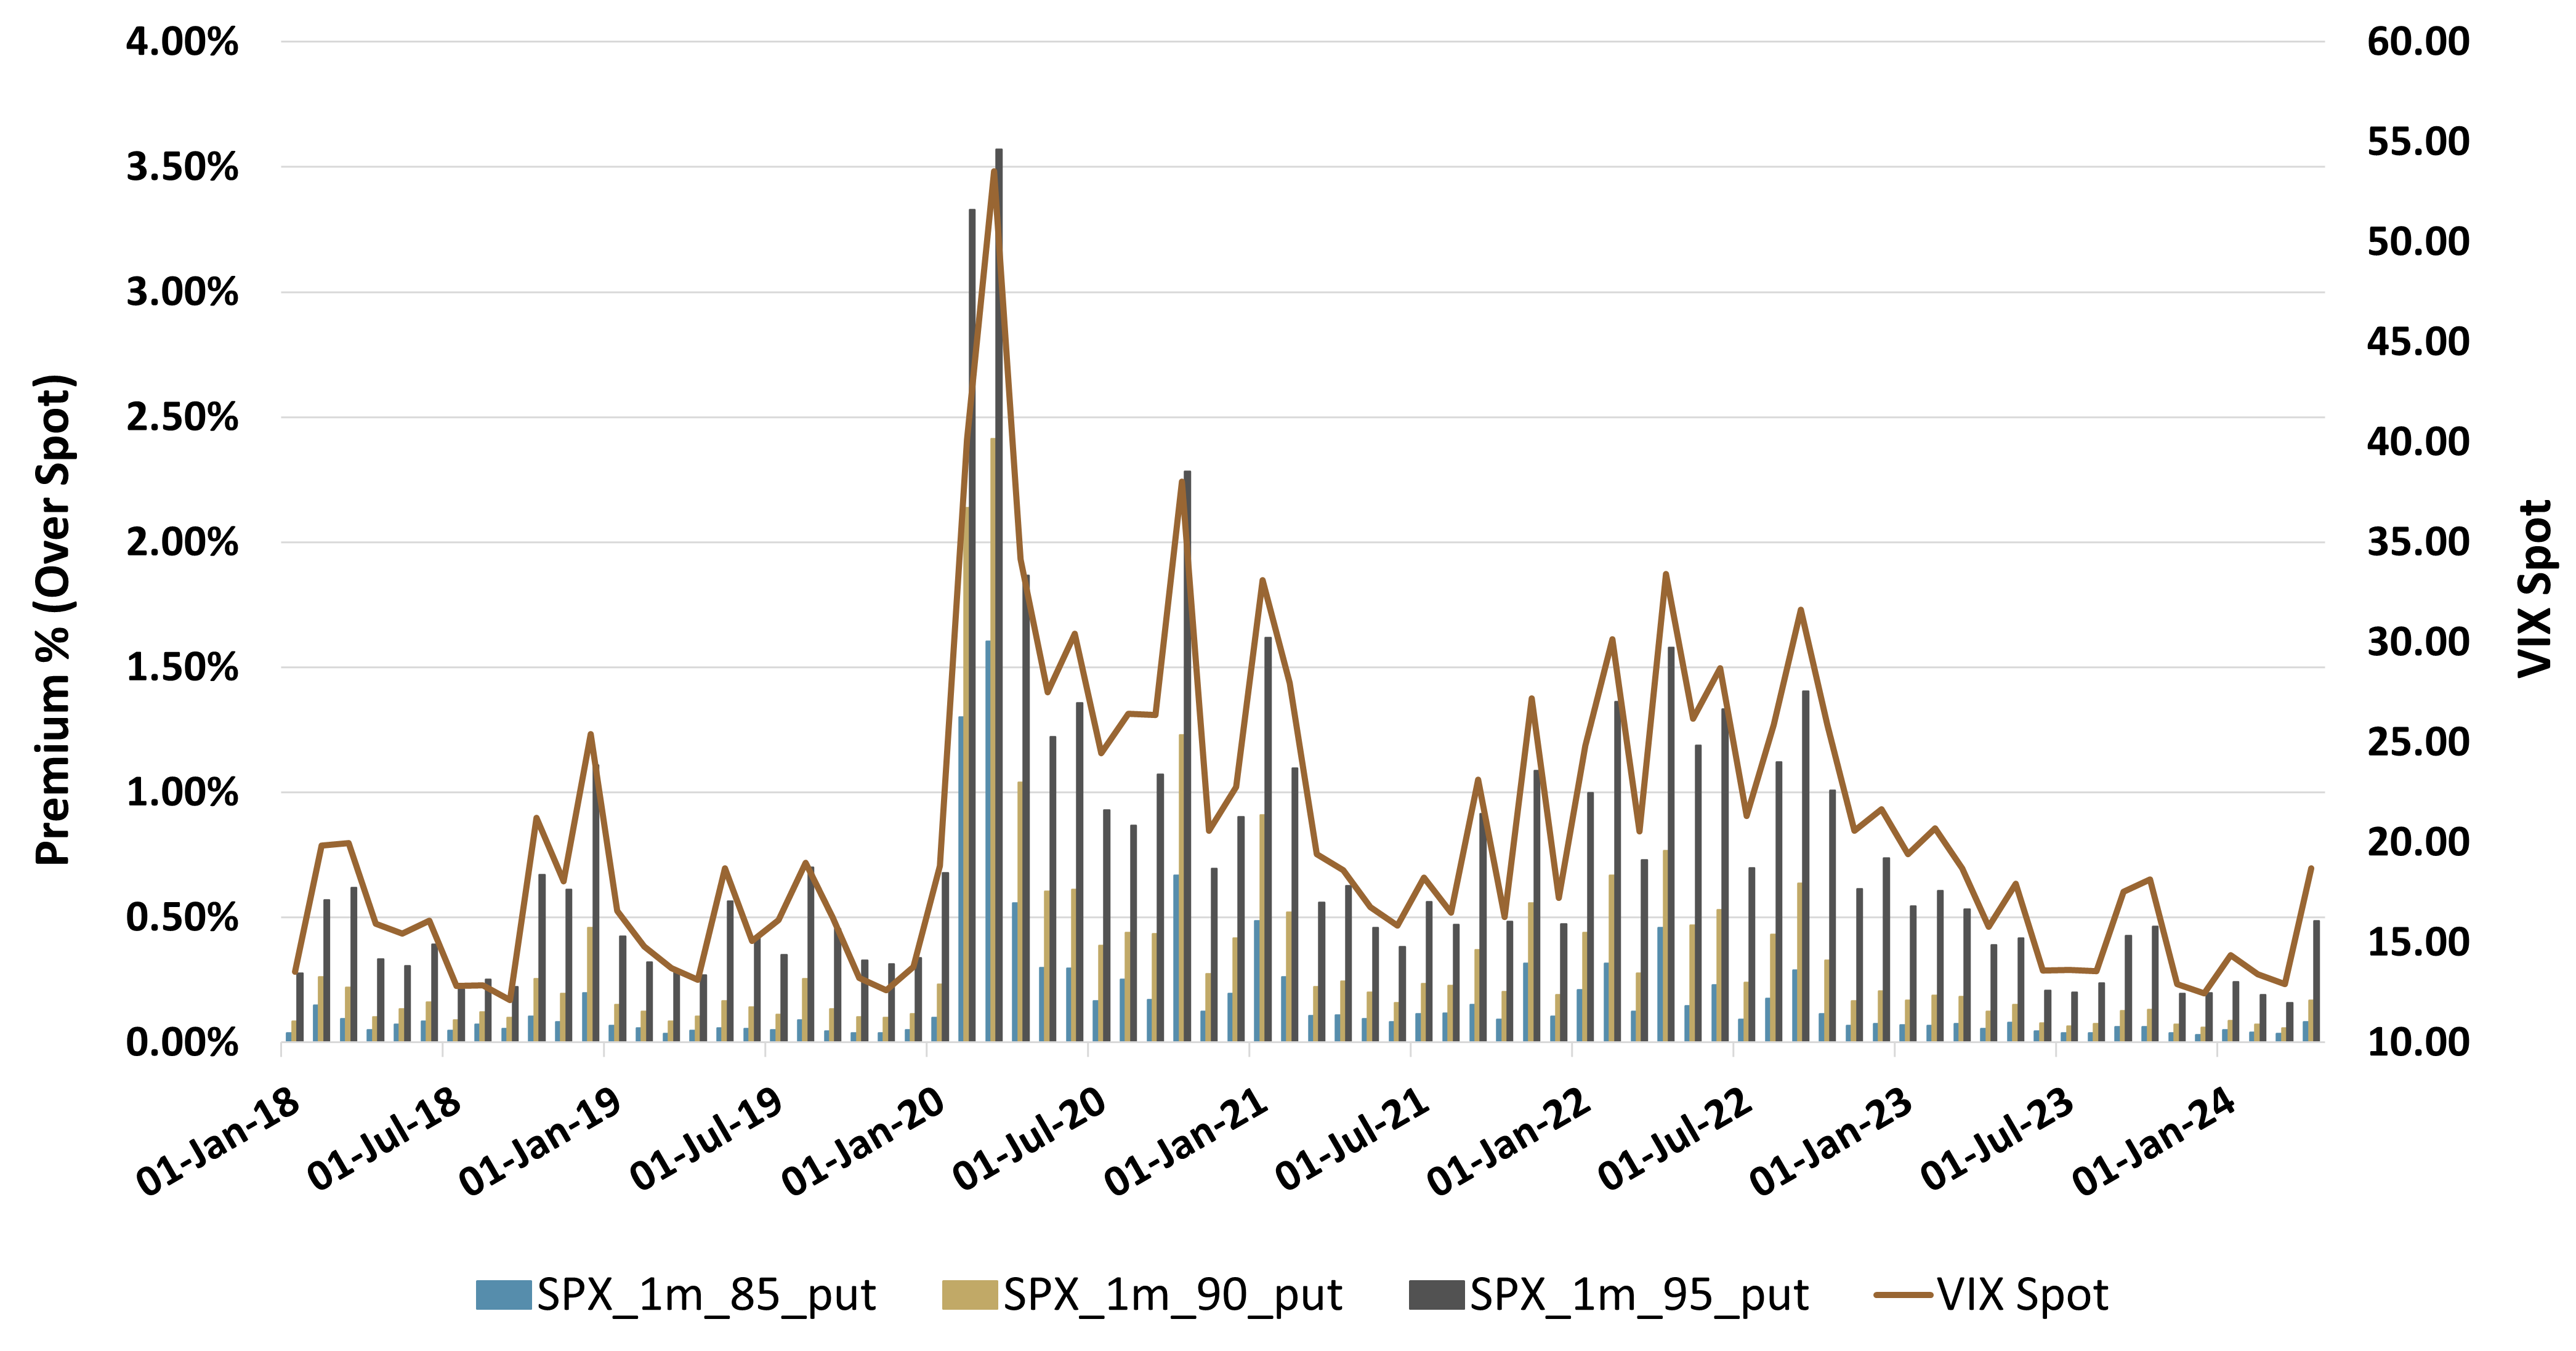
As already mentioned, VIX Spot has gone up almost 6 points since the equity market entered a new drawdown on March 28th. This situation has elevated the cost of put-based downside protection back to levels similar to the ones observed at the bottom of the most recent down move of 2023. However, with VIX still below the historical average, we continue to see some of the cheapest put-based insurance costs since 2019 (see Figure 2).
Figure 2: Cost of 1-Month SPX Put Protection at
100% Notional (LHS) vs. VIX (RHS)Source: Bloomberg, Simplify Asset Management
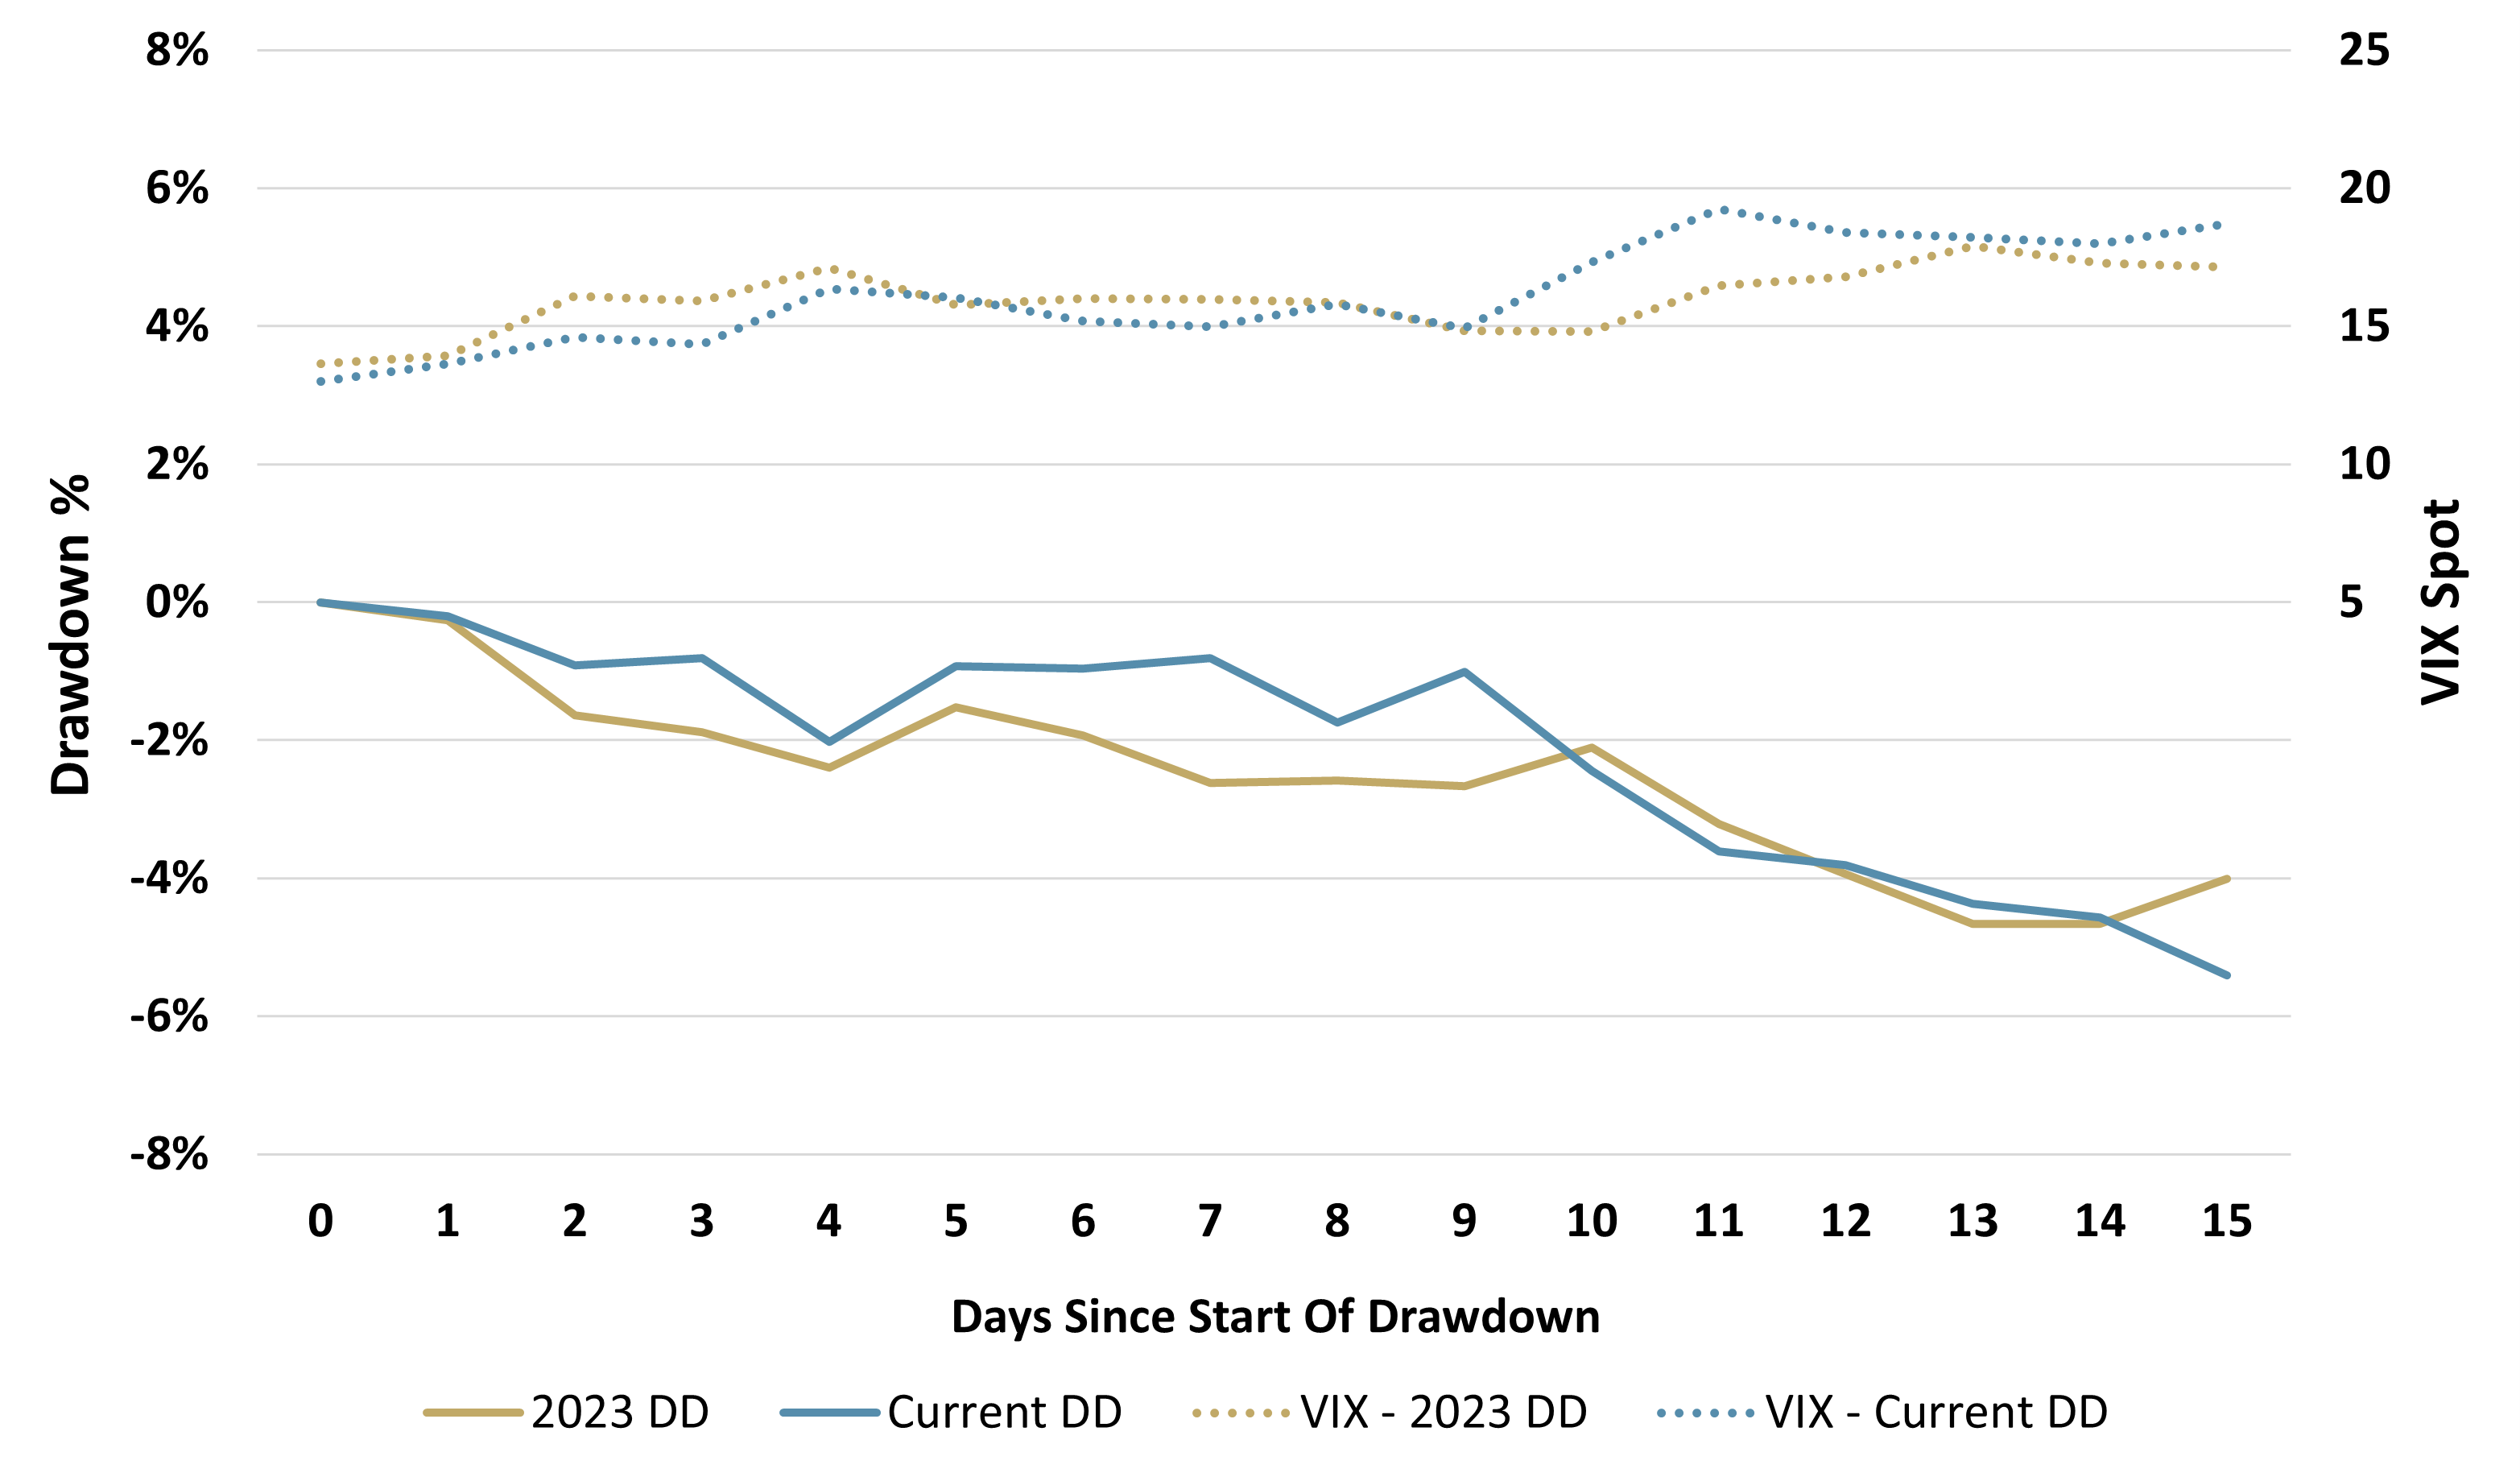
To continue with the comparison, the current drawdown has certainly been moving VIX higher faster than the move at the start of August 2023. In particular, Figure 3 shows the first three weeks of each drawdown, where VIX started at similar levels but has ended 1.5 times higher so far.
Figure 3:2023 vs. Current 2024 - Drawdown (LHS) vs VIX Spot (RHS)Source: Bloomberg, Simplify Asset Management
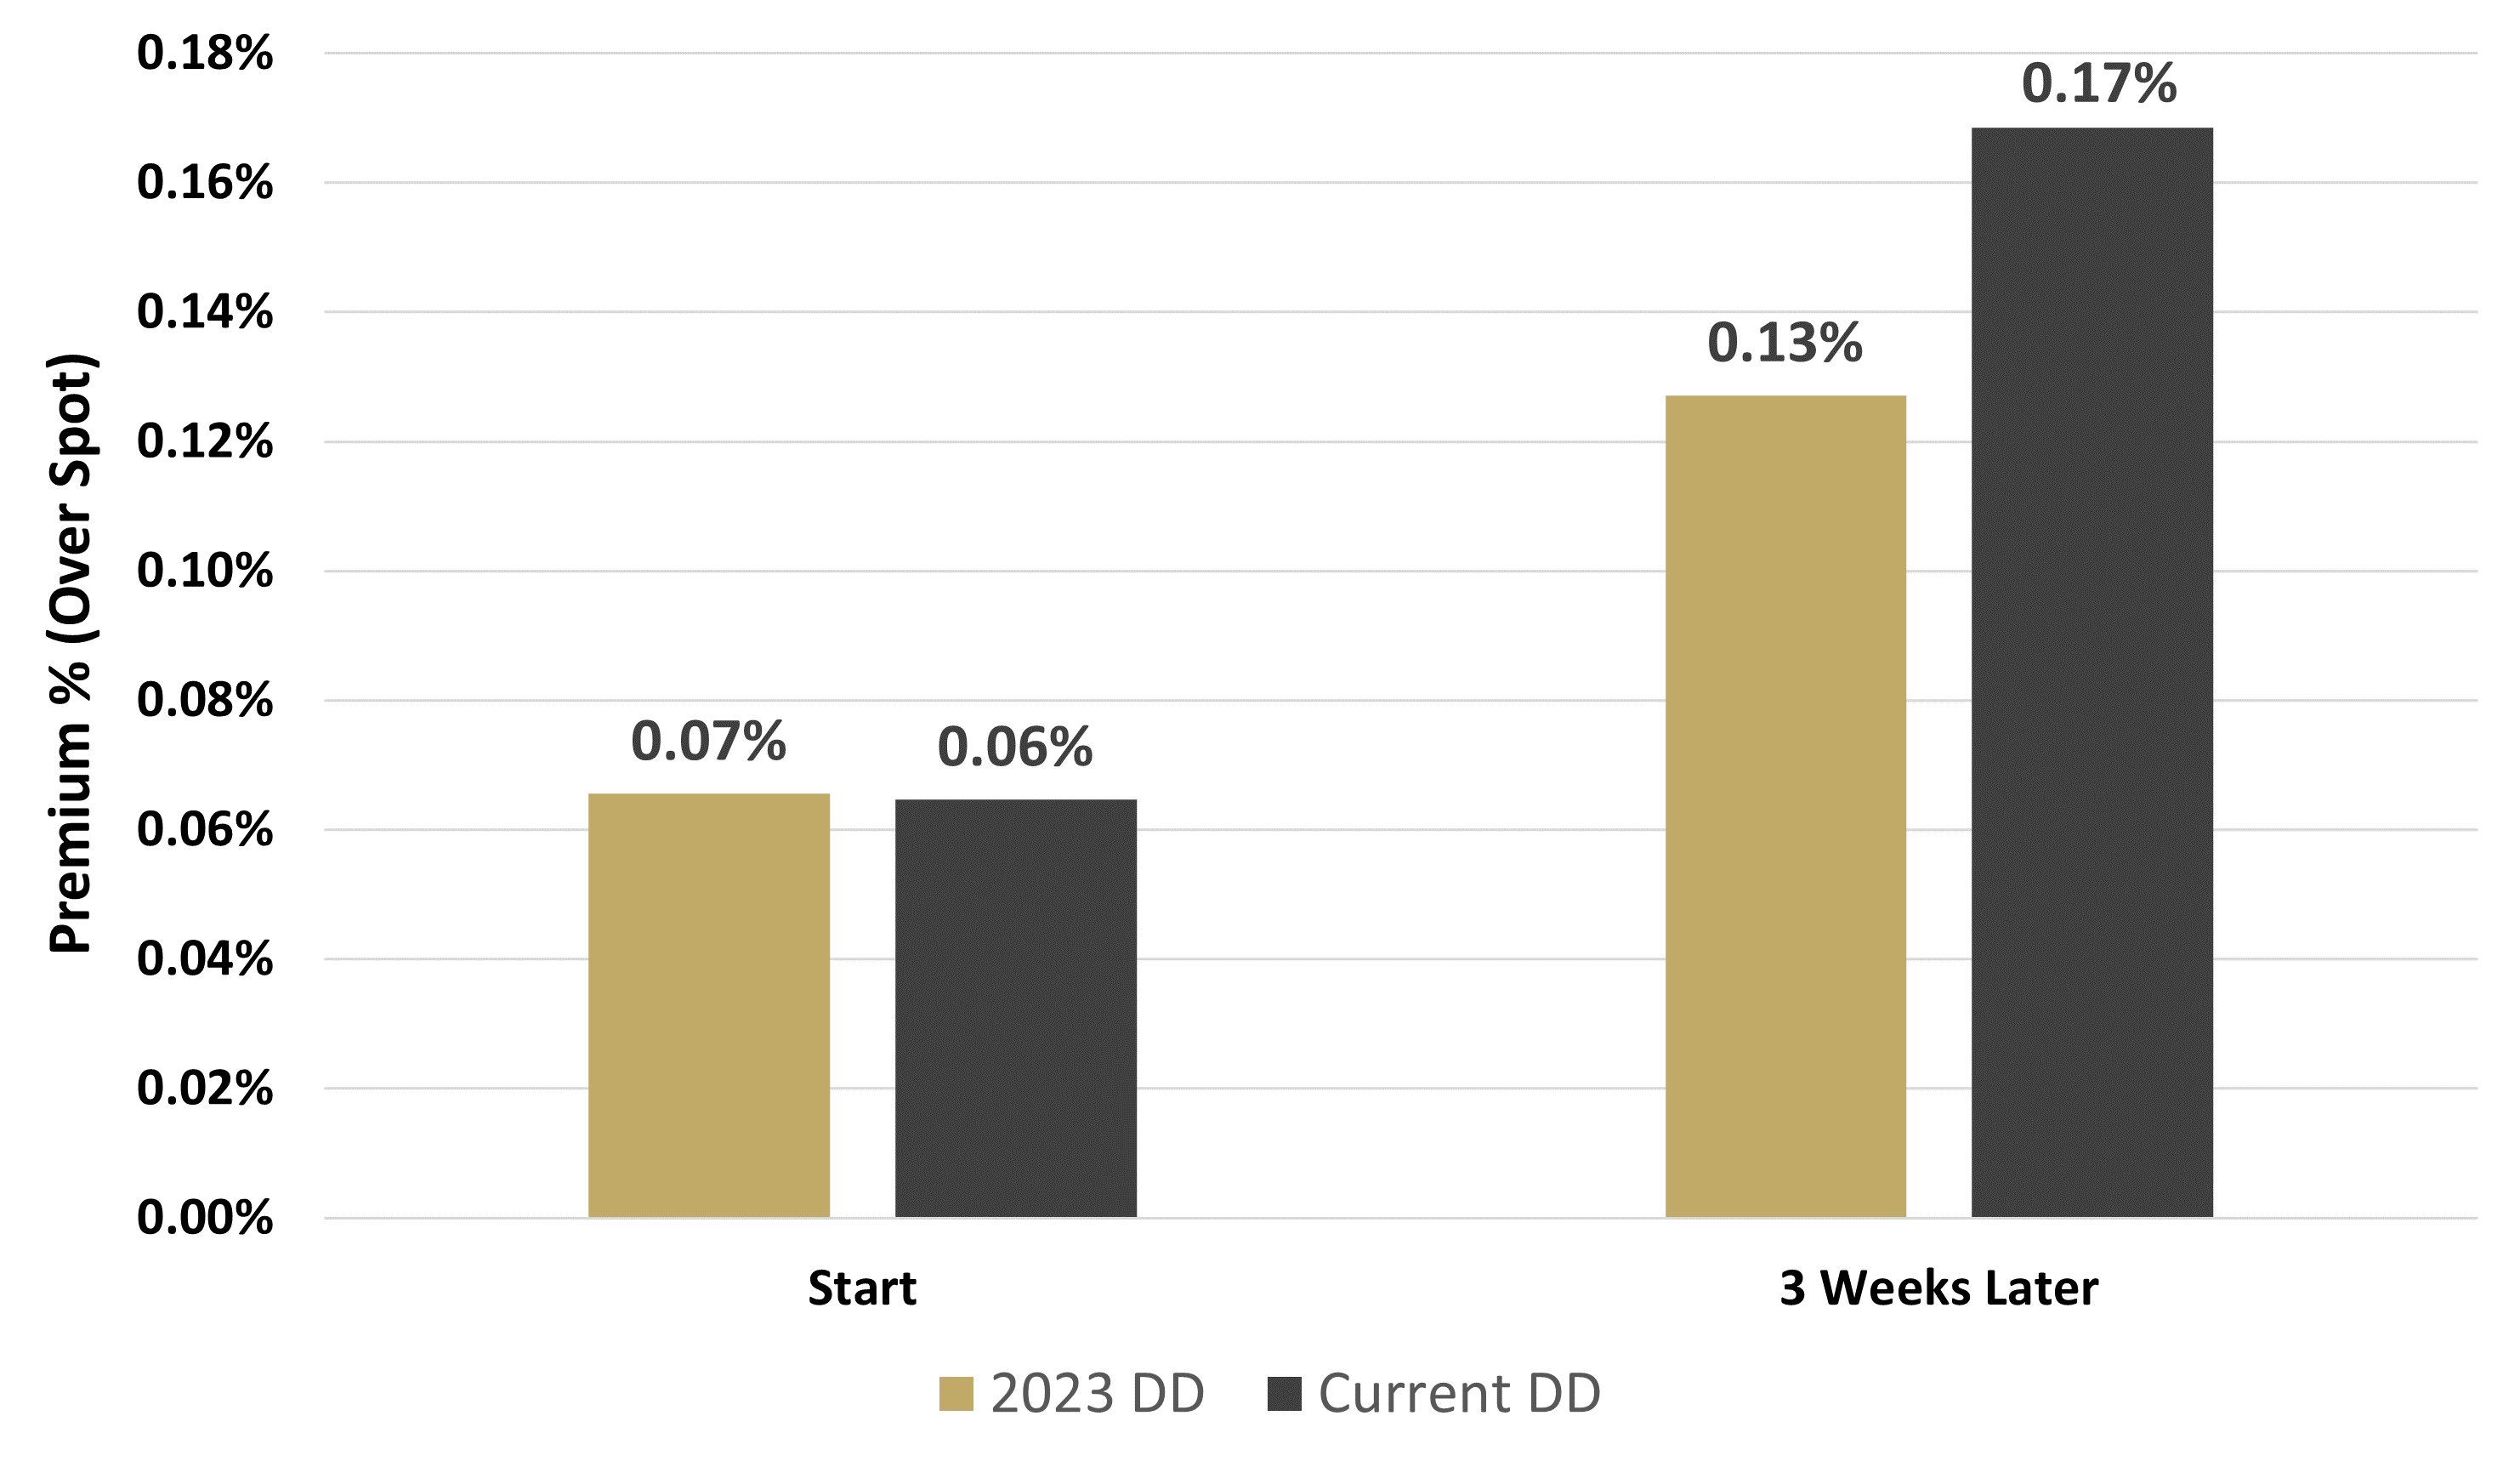
This sharper move in VIX has contributed to higher costs of put protection, as further detailed in Figure 4. Again, starting levels were similar but the same kind of protection (1 month at 10% OTM) already costs 1.3x more than it did back in August 2023.
Figure 4: Cost of SPX 1-month 90 Moneyness Put Protection at 100% Notional –
Start of Drawdown vs. 3 Weeks LaterSource: Bloomberg, Simplify Asset Management
Glossary:
VIX Index: A real-time market index representing the market's expectations for volatility over the coming 30 days.
Register for Simplify's Investor Hub
In-depth case studies provide valuable insights into practical portfolio problems and their solutions
Simplify curated model portfolios that show investors how to incorporate alternatives into their portfolio
Stay up-to-date with our latest thoughts on markets via our weekly market commentaries