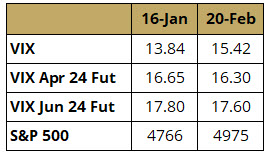
VIX has ticked up a bit since our last update despite a rally in the equity market. This is quite possible in the current environment, where the level of VIX is significantly below its historical average. However, the VIX futures curve continues to be steep (in contango), and futures continue to slide down the curve, as we can see for two representative parts of the curve in Table 1. This period is a good example of short VIX strategies generating positive returns despite VIX rising by selecting the optimal point on the curve.
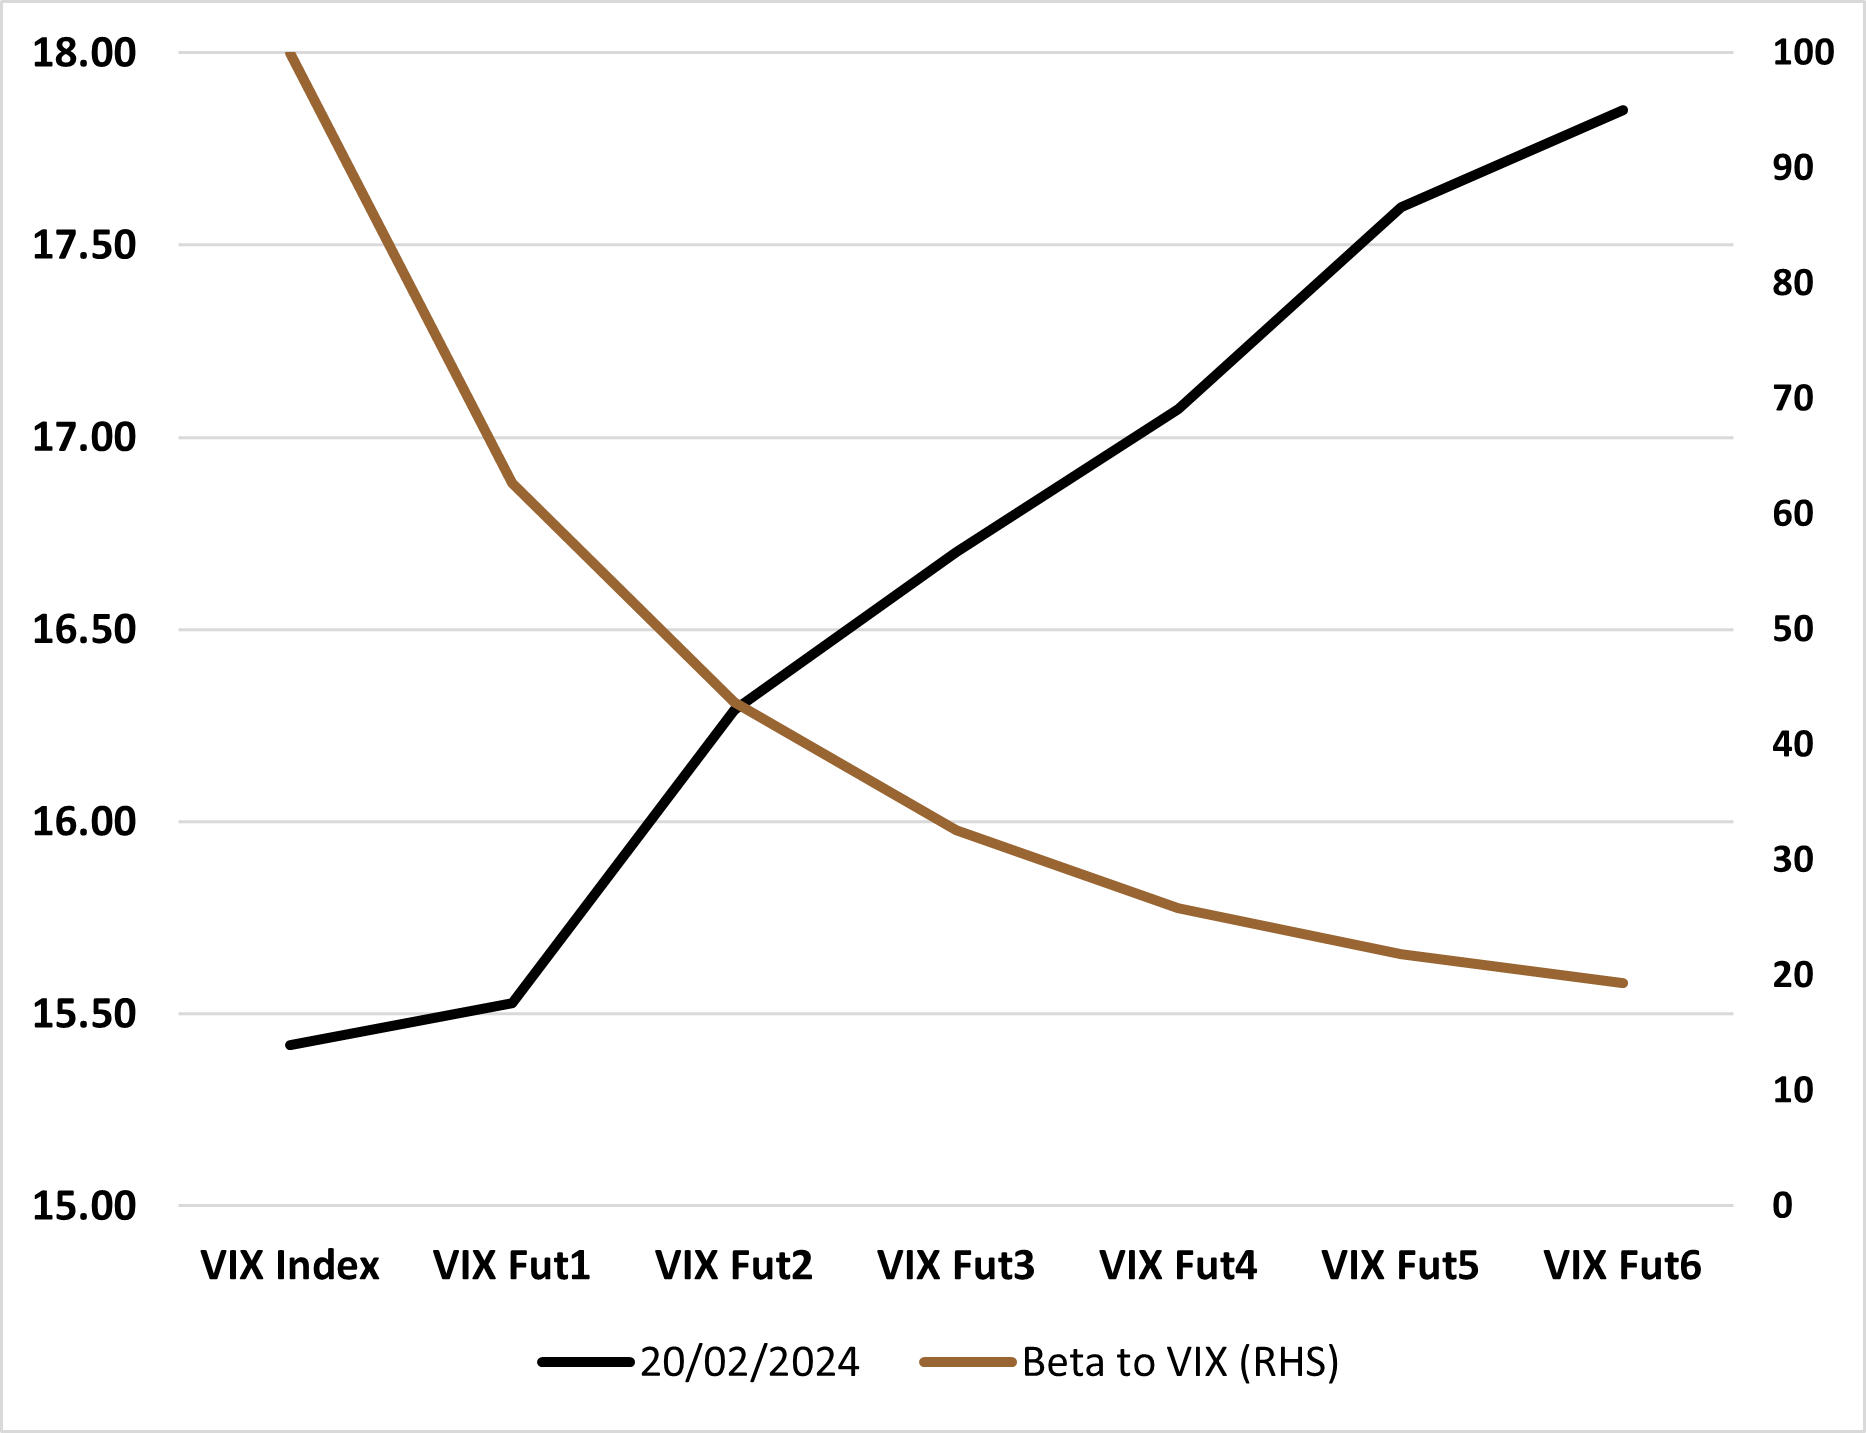
The VIX curve has the potential to remain steep (in contango) as election related uncertainties may keep the long dated VIX curve elevated. The roll down may be highest in the very front contracts, but so is the risk. Figure 1 shows that long-dated VIX contracts have significantly lower beta to VIX, albeit with much lower roll down. The risk-reward trade-off between beta and roll yield indicates the optimal point continues to be the 3rd VIX contract.
Figure 1: VIX Term Structure vs. Beta to VIXSource: Bloomberg, Simplify Asset Management
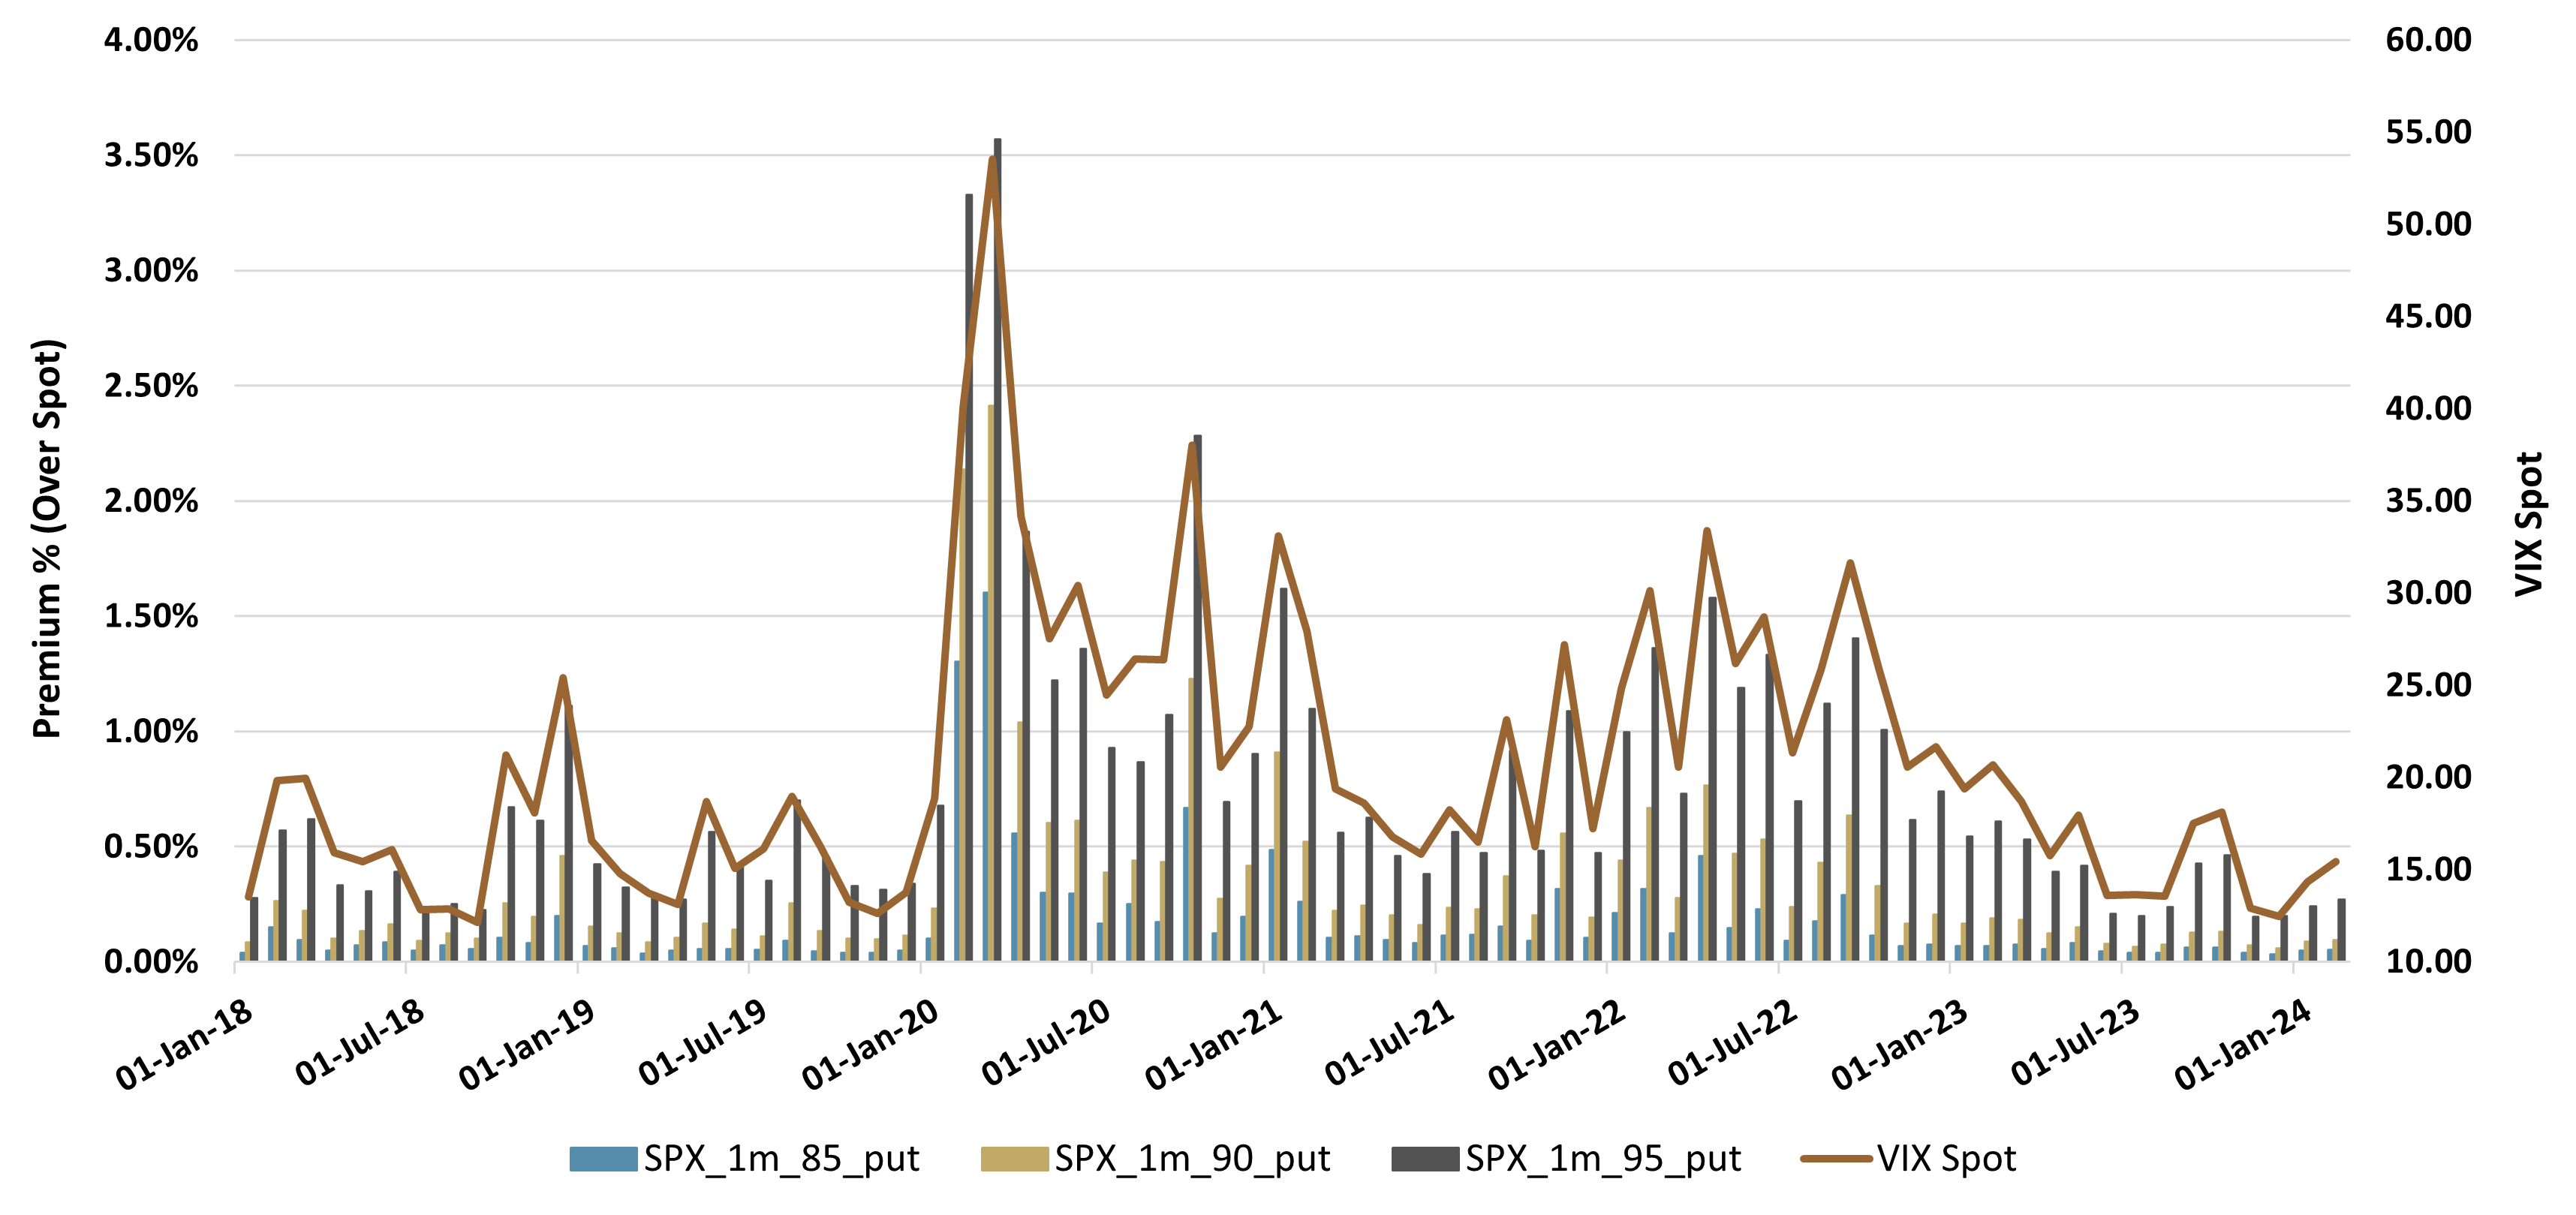
The recent increase in VIX Spot has slightly elevated the cost of SPX downside protection, but with VIX still well below its historical average, we continue to see the cheapest put-based insurance costs of the last five years (Figure 2).
Figure 2: Cost of 1-Month SPX Put Protection at 100% Notional (LHS) vs. VIX (RHS)
Source: Bloomberg, Simplify Asset Management
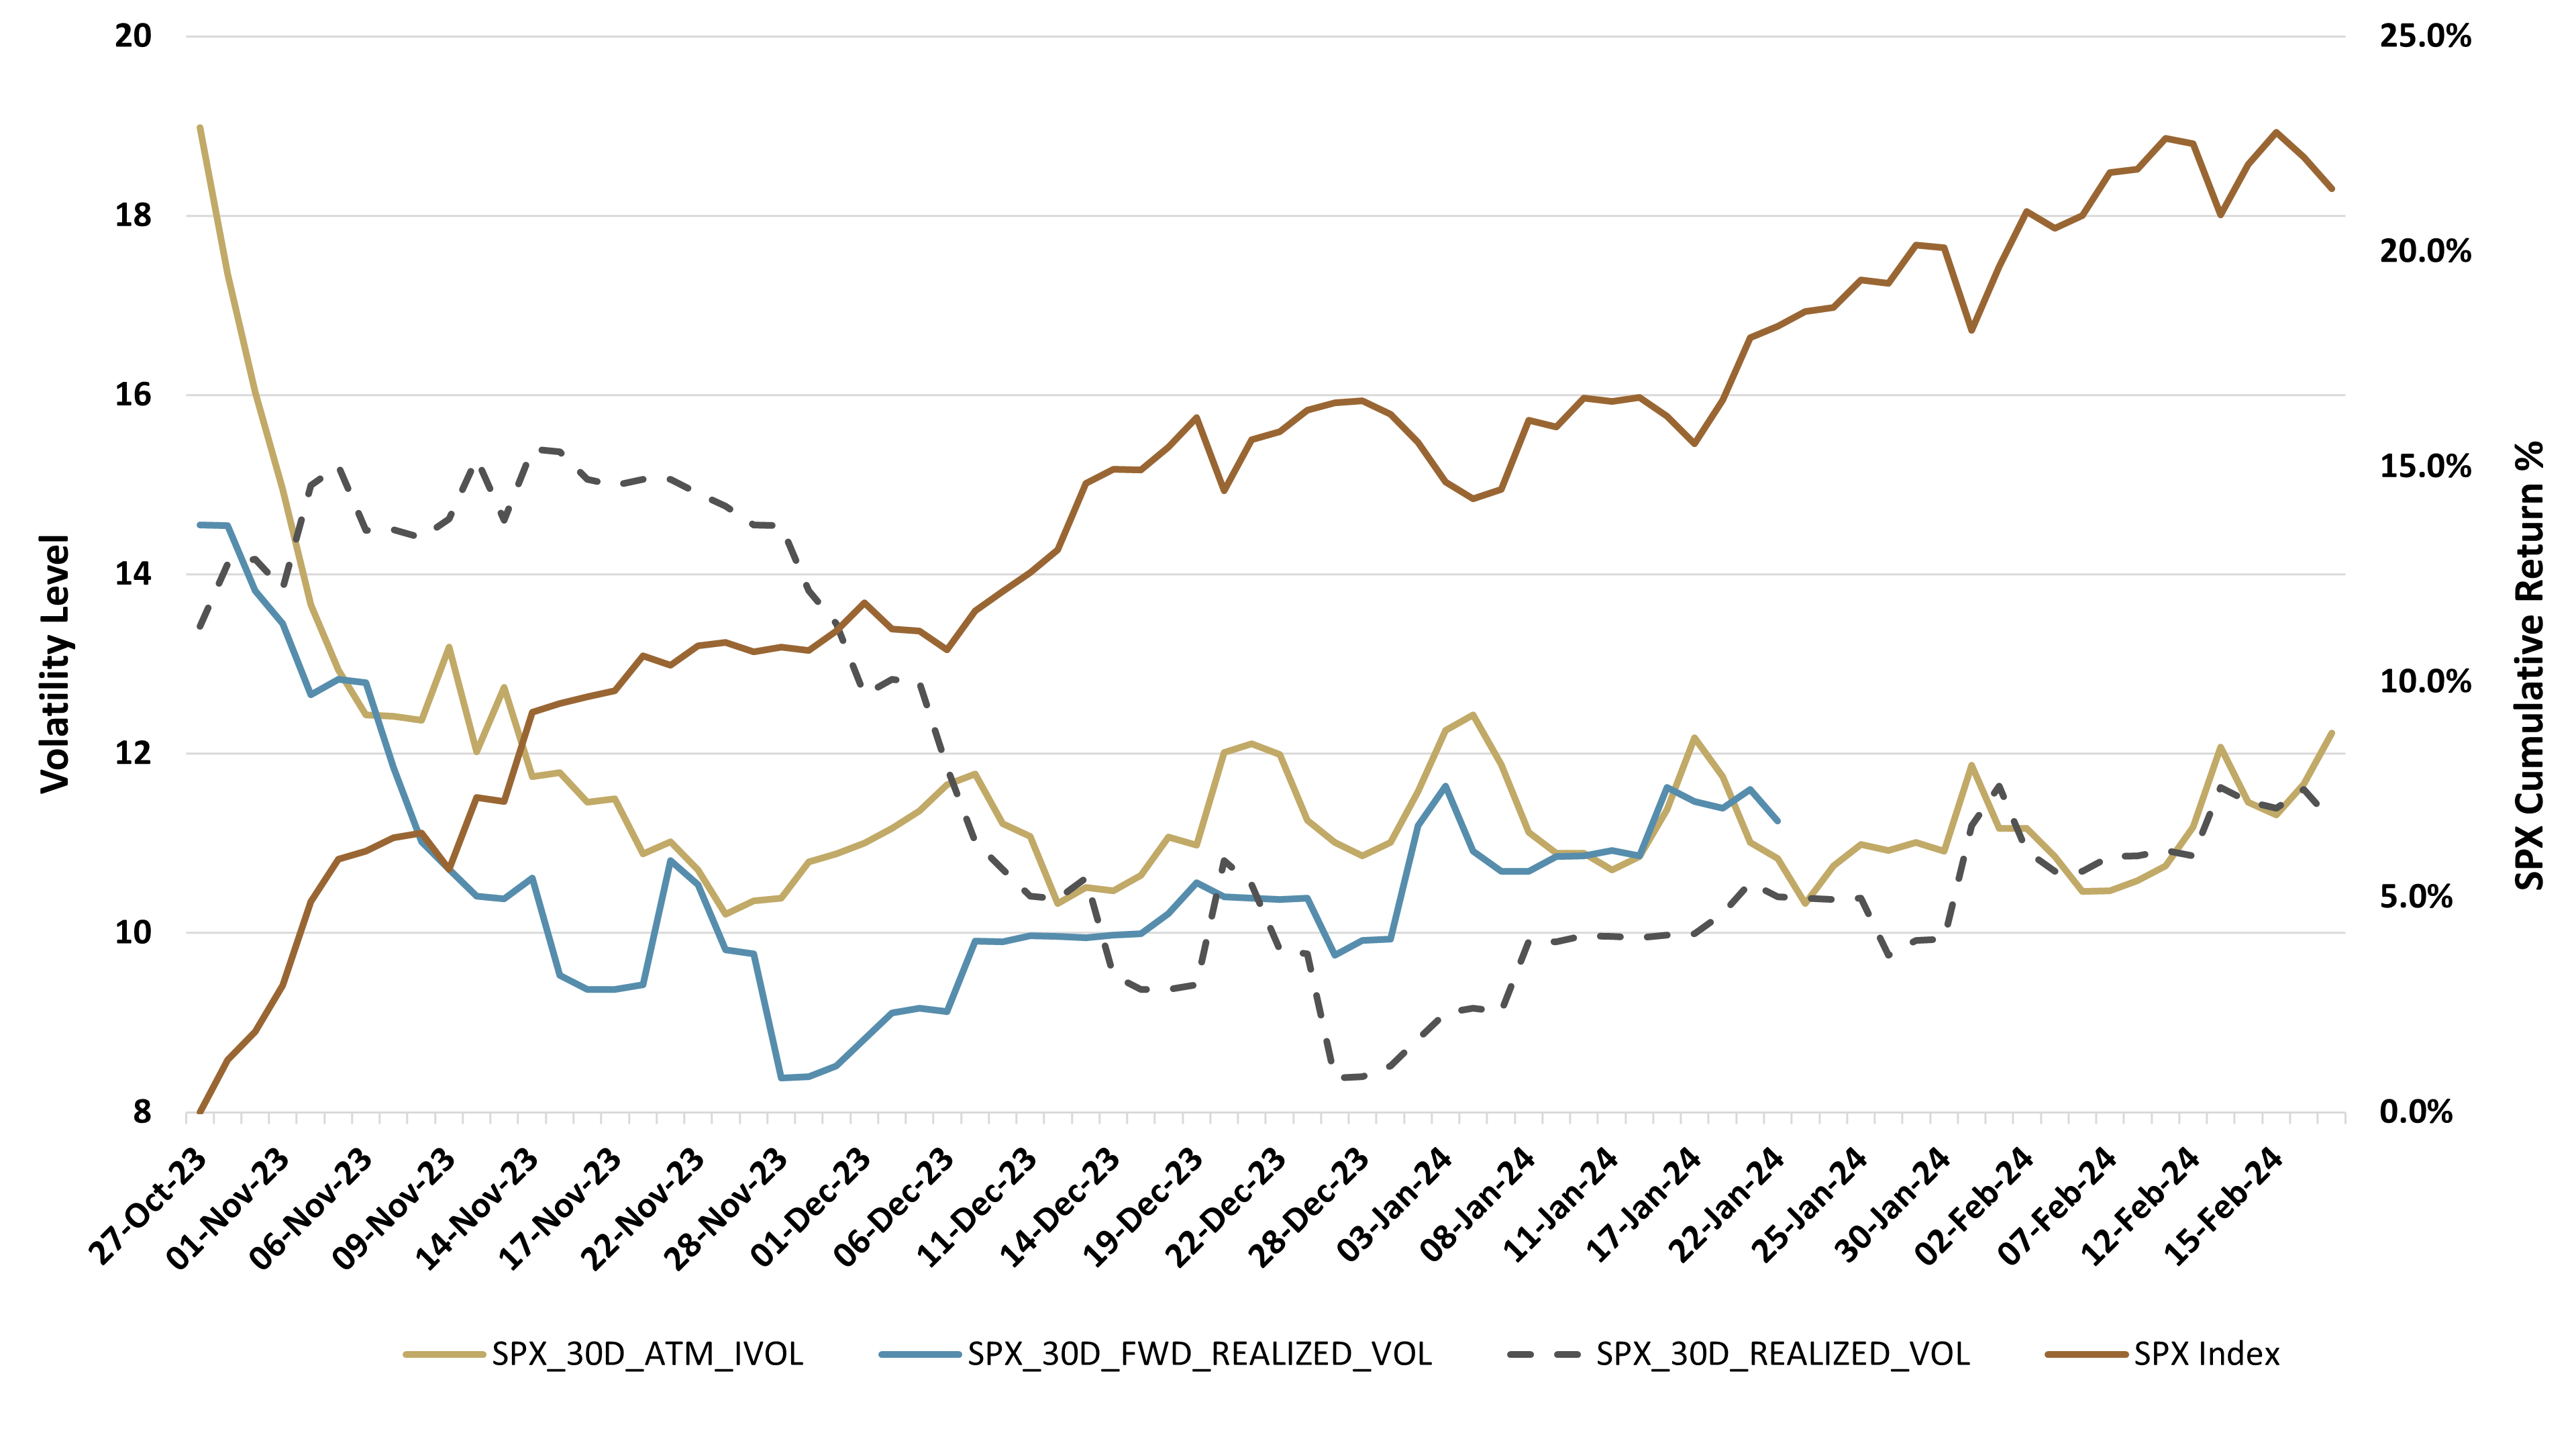
However, it is important to note that realized volatilities have been increasing since the start of the year, despite a nearly 5% rally in the equity market. As we can see in Figure 3 below, 1m Realized Volatility (dashed grey line) collapsed upon the fast recovery of Q4 2023, but it has been going up steadily ever since. This also means that the spread between Implied and Realized Volatility is shrinking as the equity market realizes future volatility expectations.
Figure 3: SPX 1m ATM IV and Realized Past/Forward Volatility in the Context of the Recent SPX RallySource: Bloomberg, Simplify Asset Management
We can now try to put this into the context of option premia. Figure 3 also shows the 1m Forward Realized Volatility (solid grey line), which we can compare with the 1m ATM Implied Volatility (solid yellow line) to assess whether options have been priced “fairly” over this period in terms of volatility.
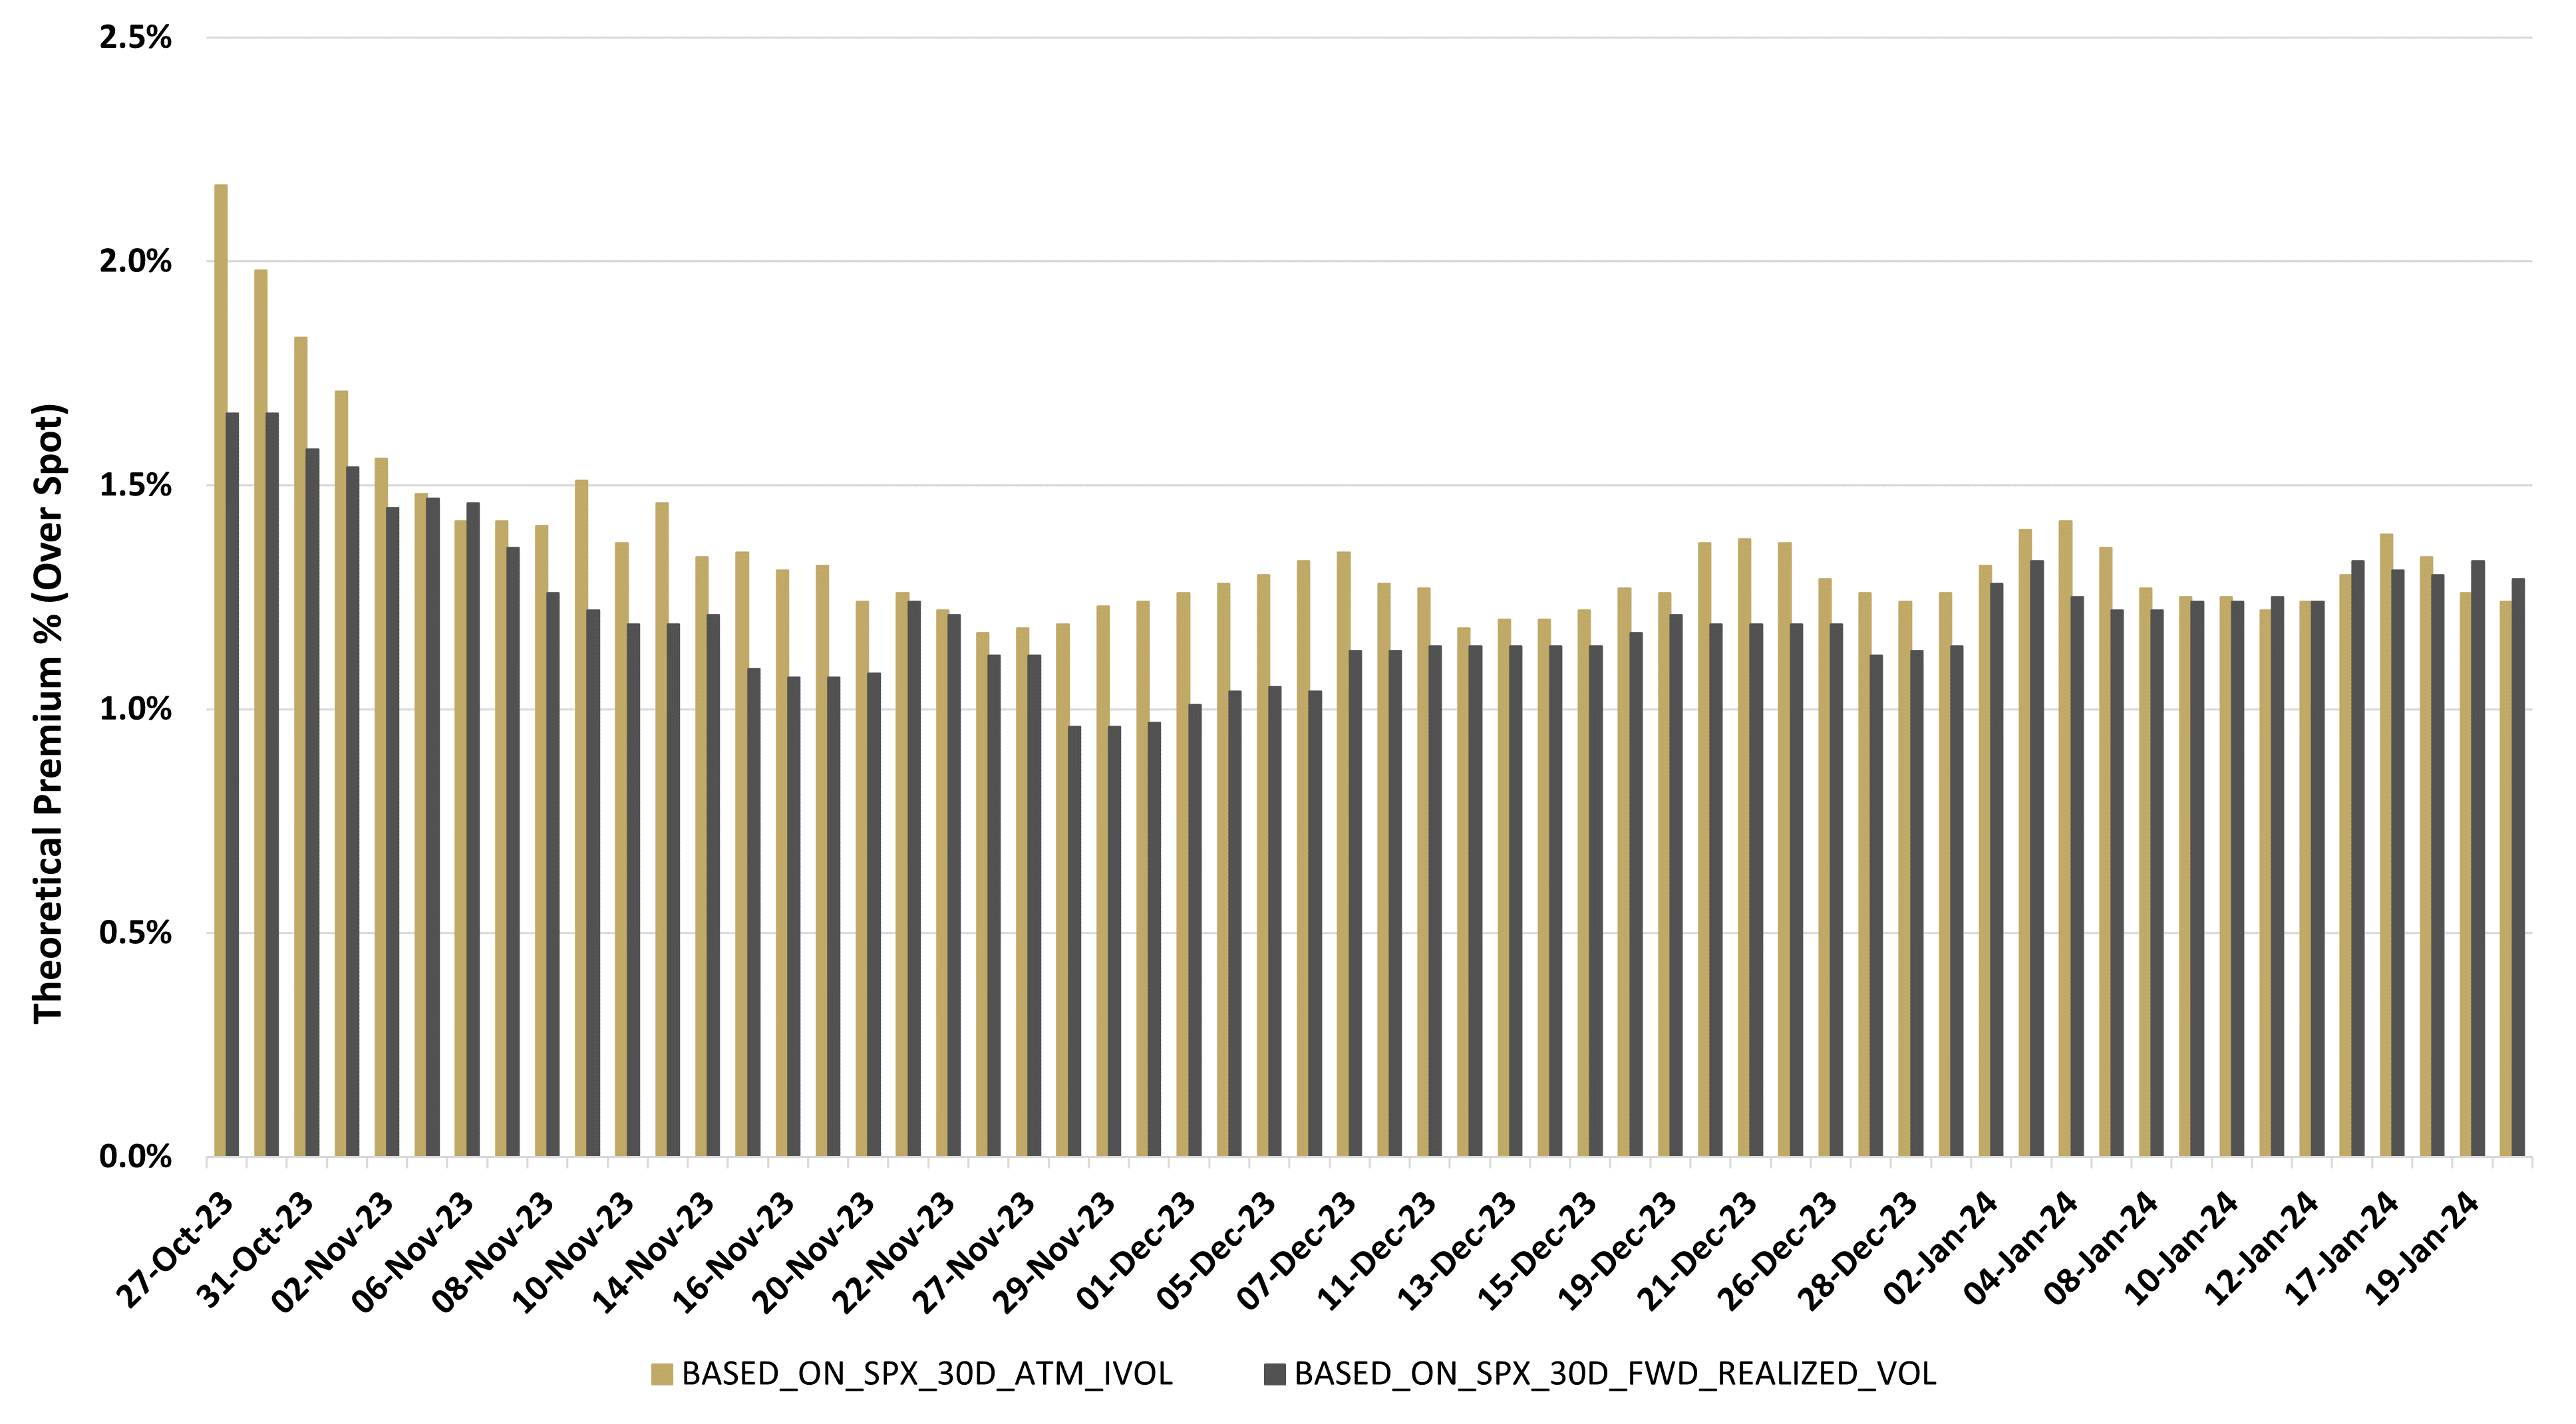
As we can see, implied volatilities stayed above forward volatility up until January 2024, where the relationship seems to have started to reverse. To get a more intuitive view of the impact of this shift on equity option premia, Figure 4 shows the theoretical cost of puts using the two different volatility measures. Here we see that for most of this period puts have been priced higher than their theoretical value at future realized volatility (which is normally the case with SPX options due to the overall downside risk bias in the broad equity market, among other factors), but this trend has changed in the recent months indicating similar levels of volatility risk being factored into the premium.
Figure 4: Theoretical Cost of 1-Month SPX Put Protection at 100% Notional Using Implied Volatility vs. Forward Realized VolatilitySource: Bloomberg, Simplify Asset Management
Glossary:
Contango: A situation where the futures price of an asset is higher than the spot price. This results in an upward-sloping forward curve.
Option: An option is a contract that gives the buyer the right to either buy (in the case of a call option) or sell (in the case of a put option) an underlying asset at a pre-determined price ("strike") by a specific date ("expiry"). An "outright" is another name for a single option leg. A "spread" is when options are bought at one strike and an equal amount of options are sold at a different strike, all at the same expiry.
VIX Index: A real-time market index representing the market's expectations for volatility over the coming 30 days.
Register for Simplify's Investor Hub
In-depth case studies provide valuable insights into practical portfolio problems and their solutions
Simplify curated model portfolios that show investors how to incorporate alternatives into their portfolio
Stay up-to-date with our latest thoughts on markets via our weekly market commentaries