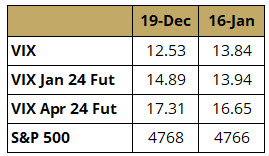
VIX has ticked up a bit since our last update, despite the equity market remaining unchanged, a reasonable outcome when the level of VIX is significantly below the historical average, as it is now. However, VIX futures contracts have continued to slide down the curve, as we see for two representative parts of the curve in Table 1. This period is a good example of short VIX strategies generating positive returns, despite VIX rising, due to a steep upward sloping (“contango”) VIX curve.
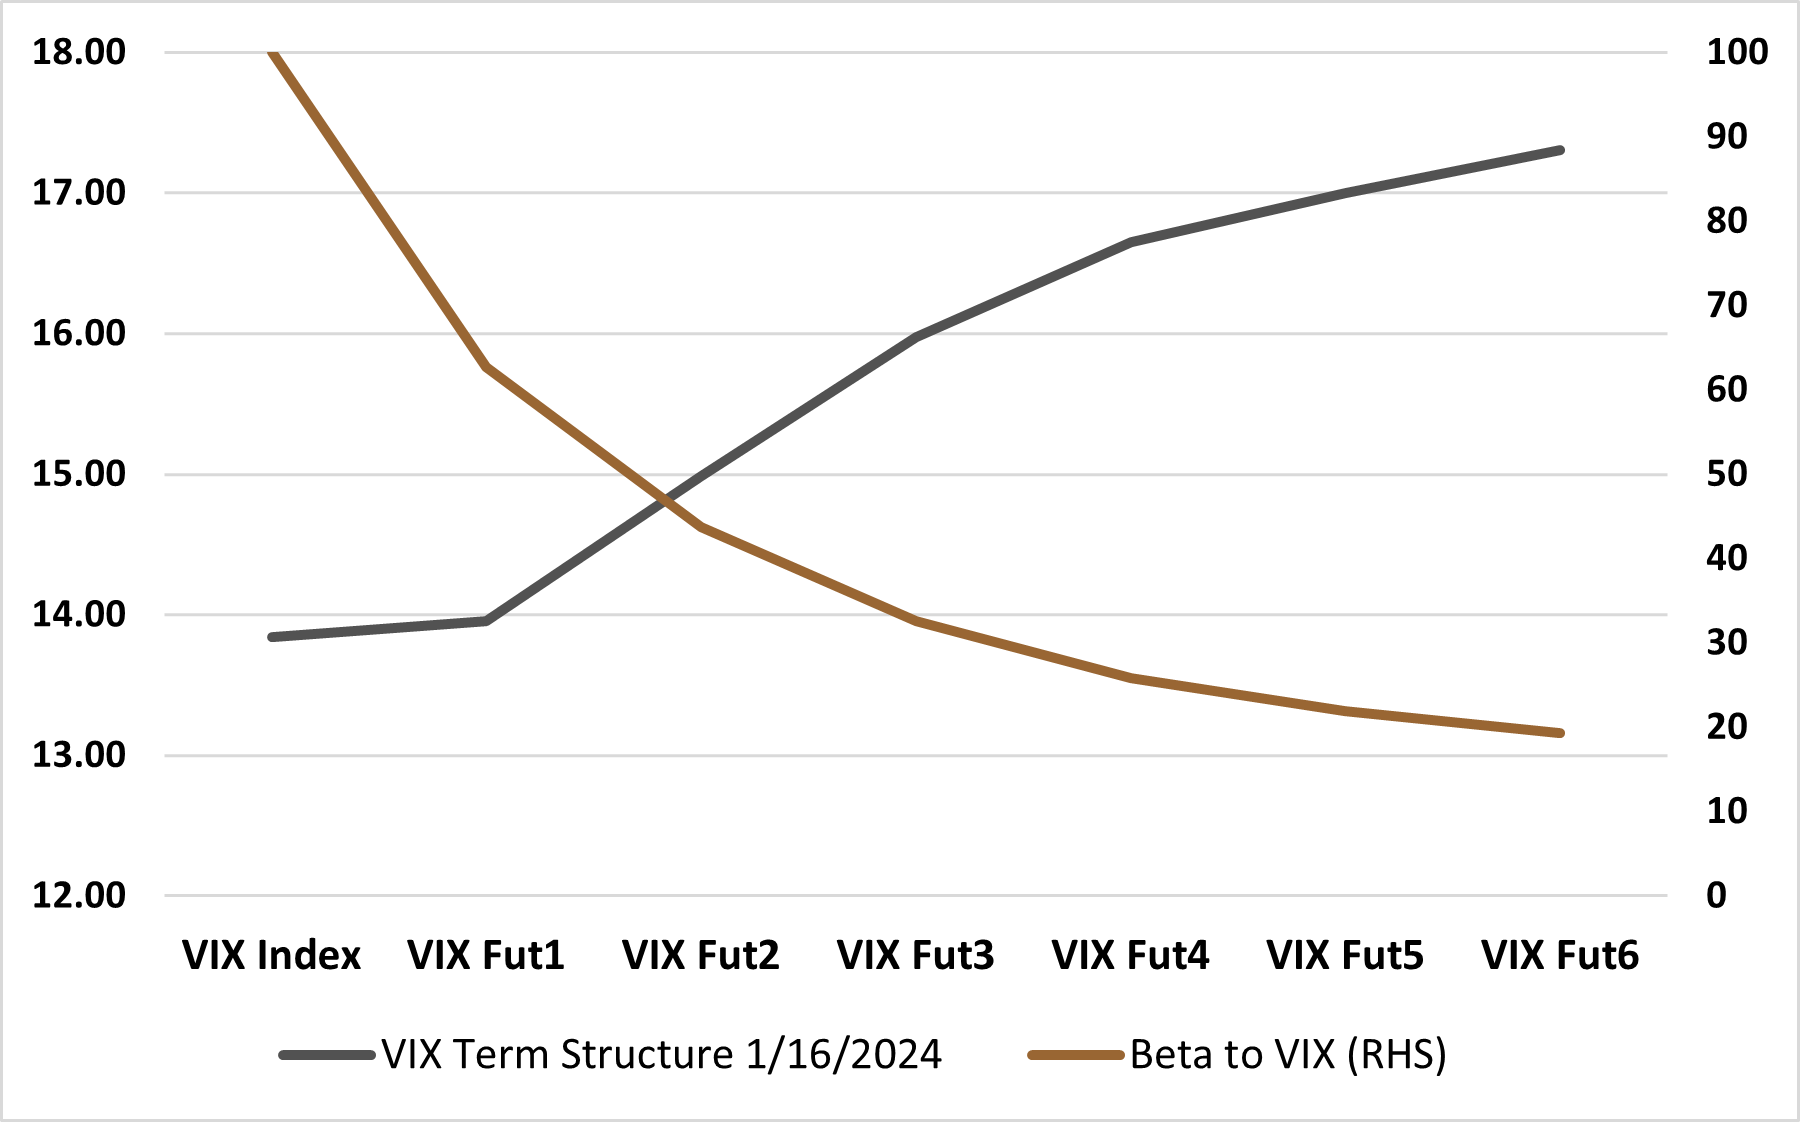
The VIX curve has the potential to remain steeply in contango as the U.S. election and other geopolitical uncertainties may keep the long dated VIX curve elevated. Indeed, the roll down may be highest in the front contracts but so is the risk. Figure 1 shows that long-dated VIX contracts have significantly lower beta to VIX, albeit with much lower roll down. The risk-reward trade-off between beta and roll indicates that the optimal point is the 4th VIX contract rolling to the 3rd contract.
Figure 1: VIX Term Structure vs. Beta to VIXSource: Bloomberg, Simplify Asset Management
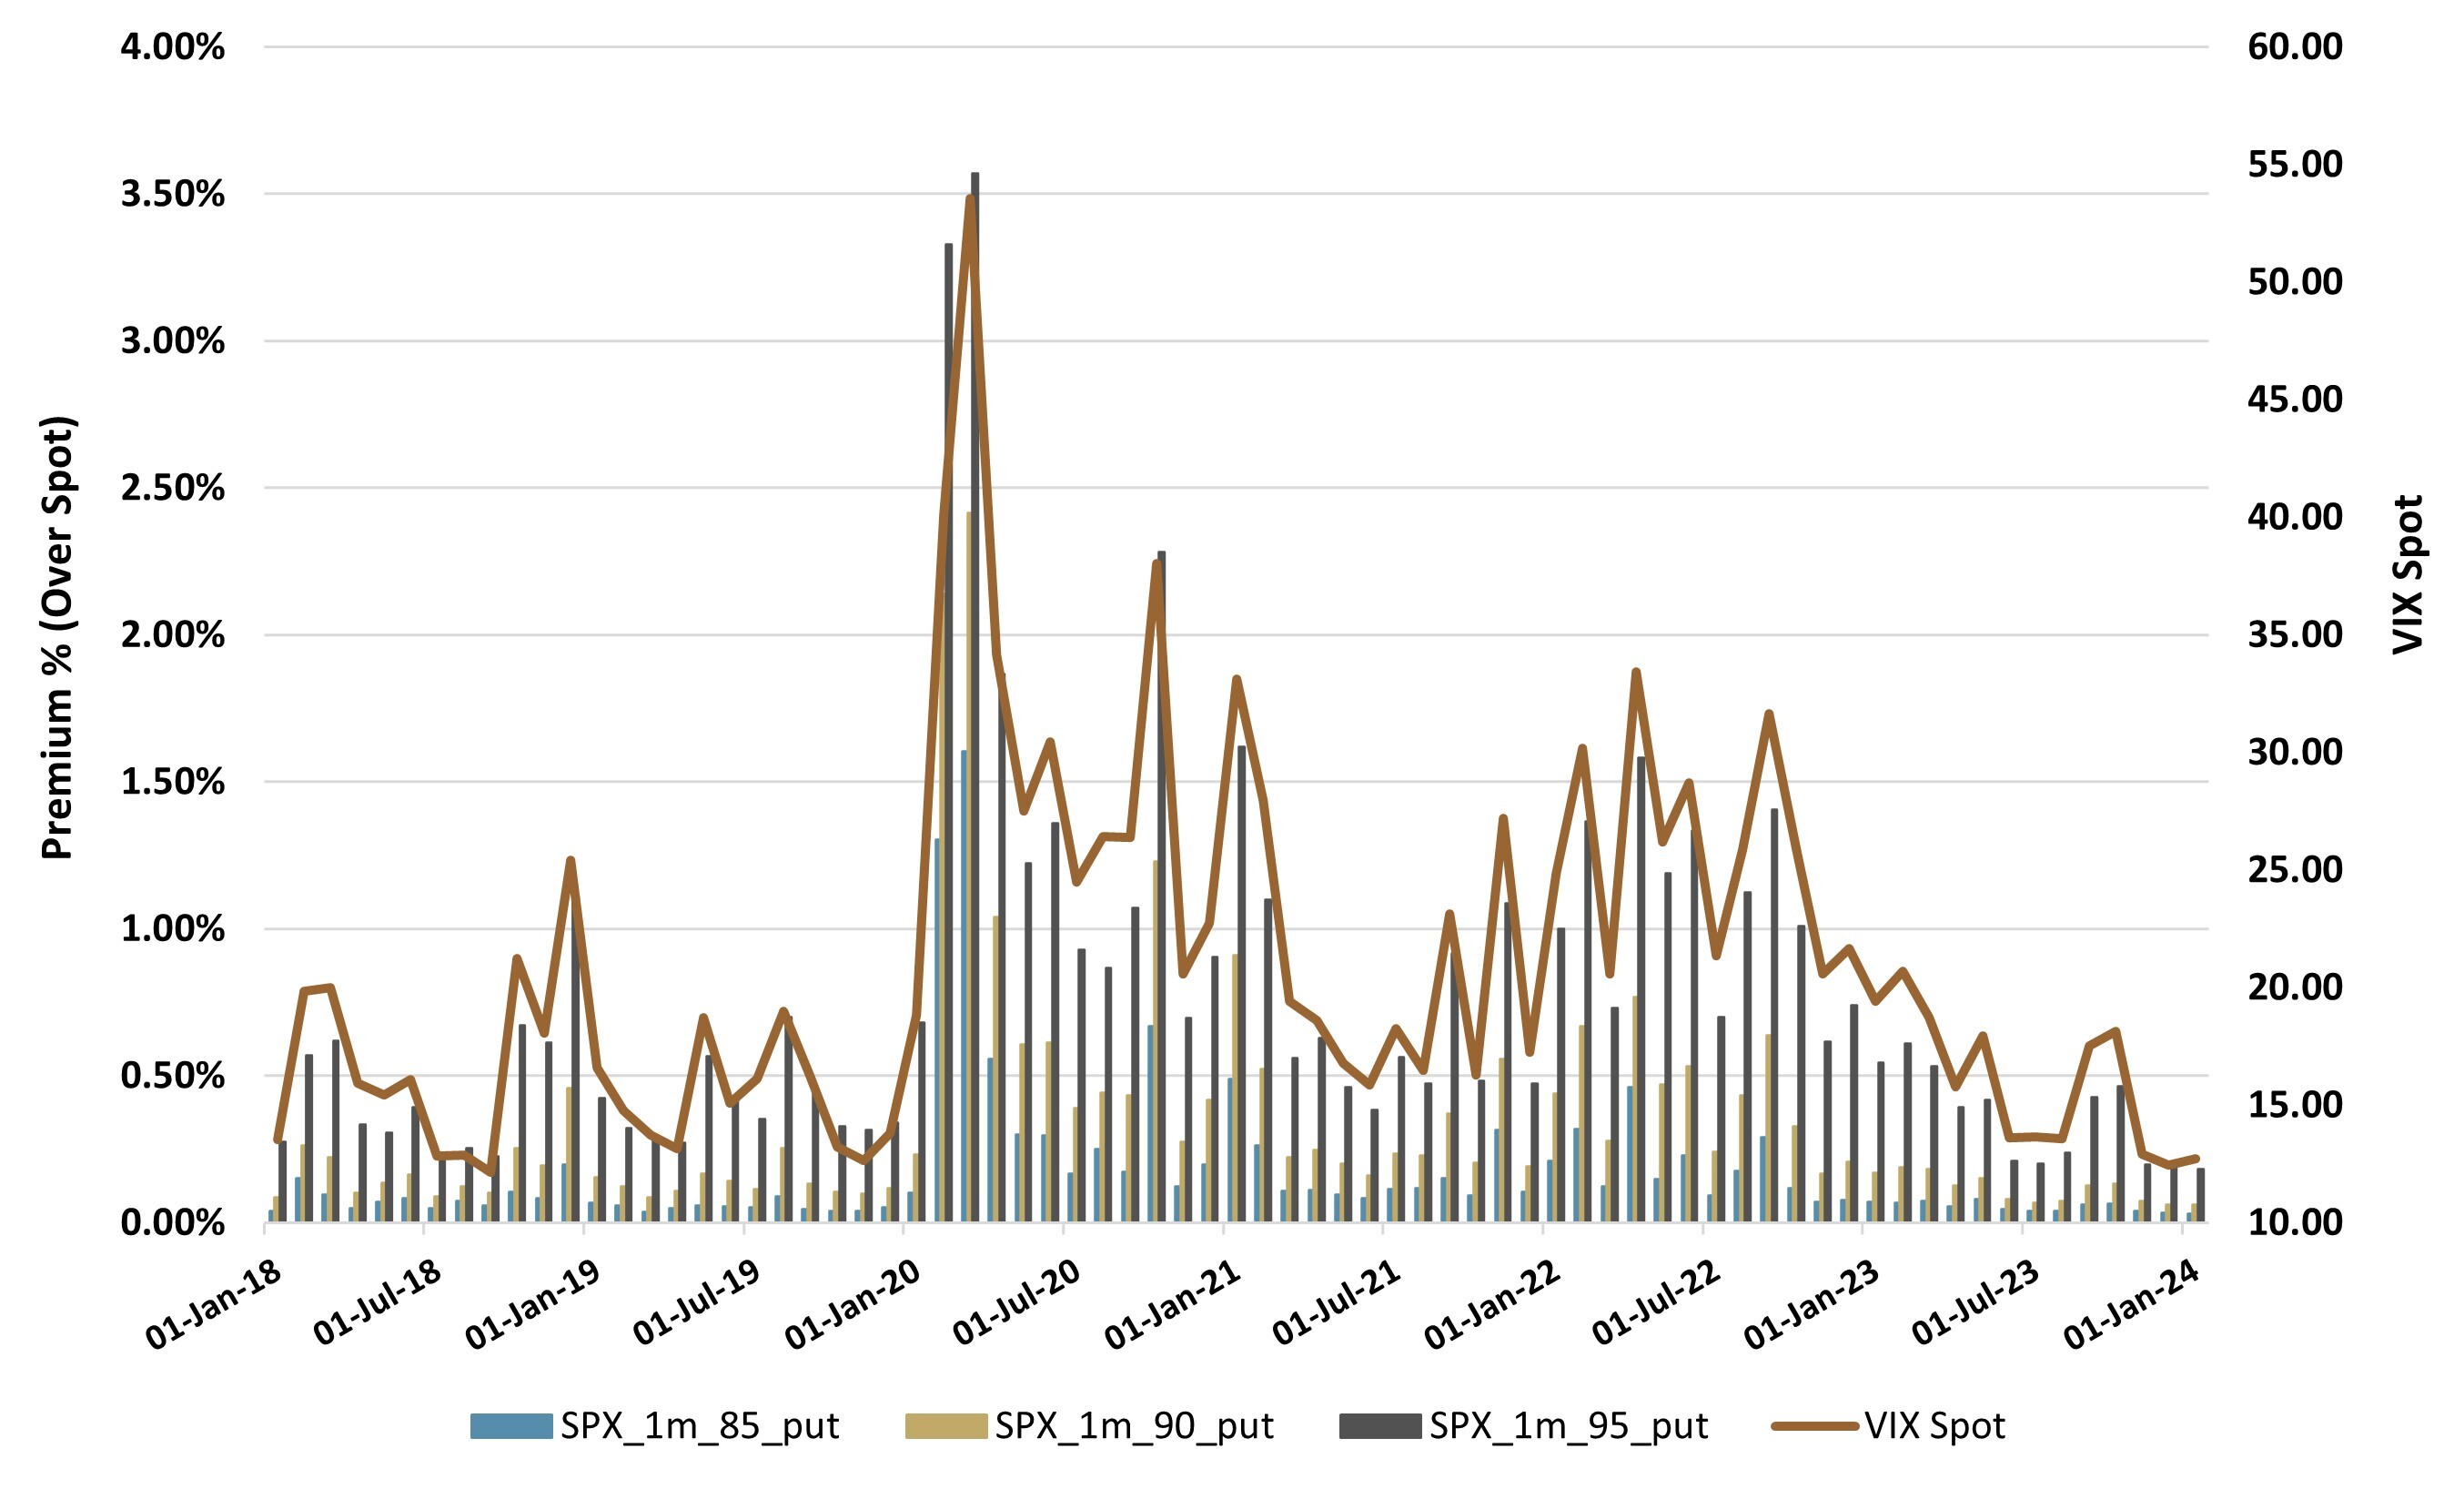
Moving to equity hedging considerations, a flat VIX has kept SPX out-of-the-money (OTM) put premia at their lowest levels since 2017, creating one of the cheapest 1-month 5% OTM downside protection costs of the last 15 years (see Figure 2).
Figure 2: Cost of 1-Month SPX Put Protection at
100% Notional (LHS) vs. VIX (RHS)Source: Bloomberg, Simplify Asset Management
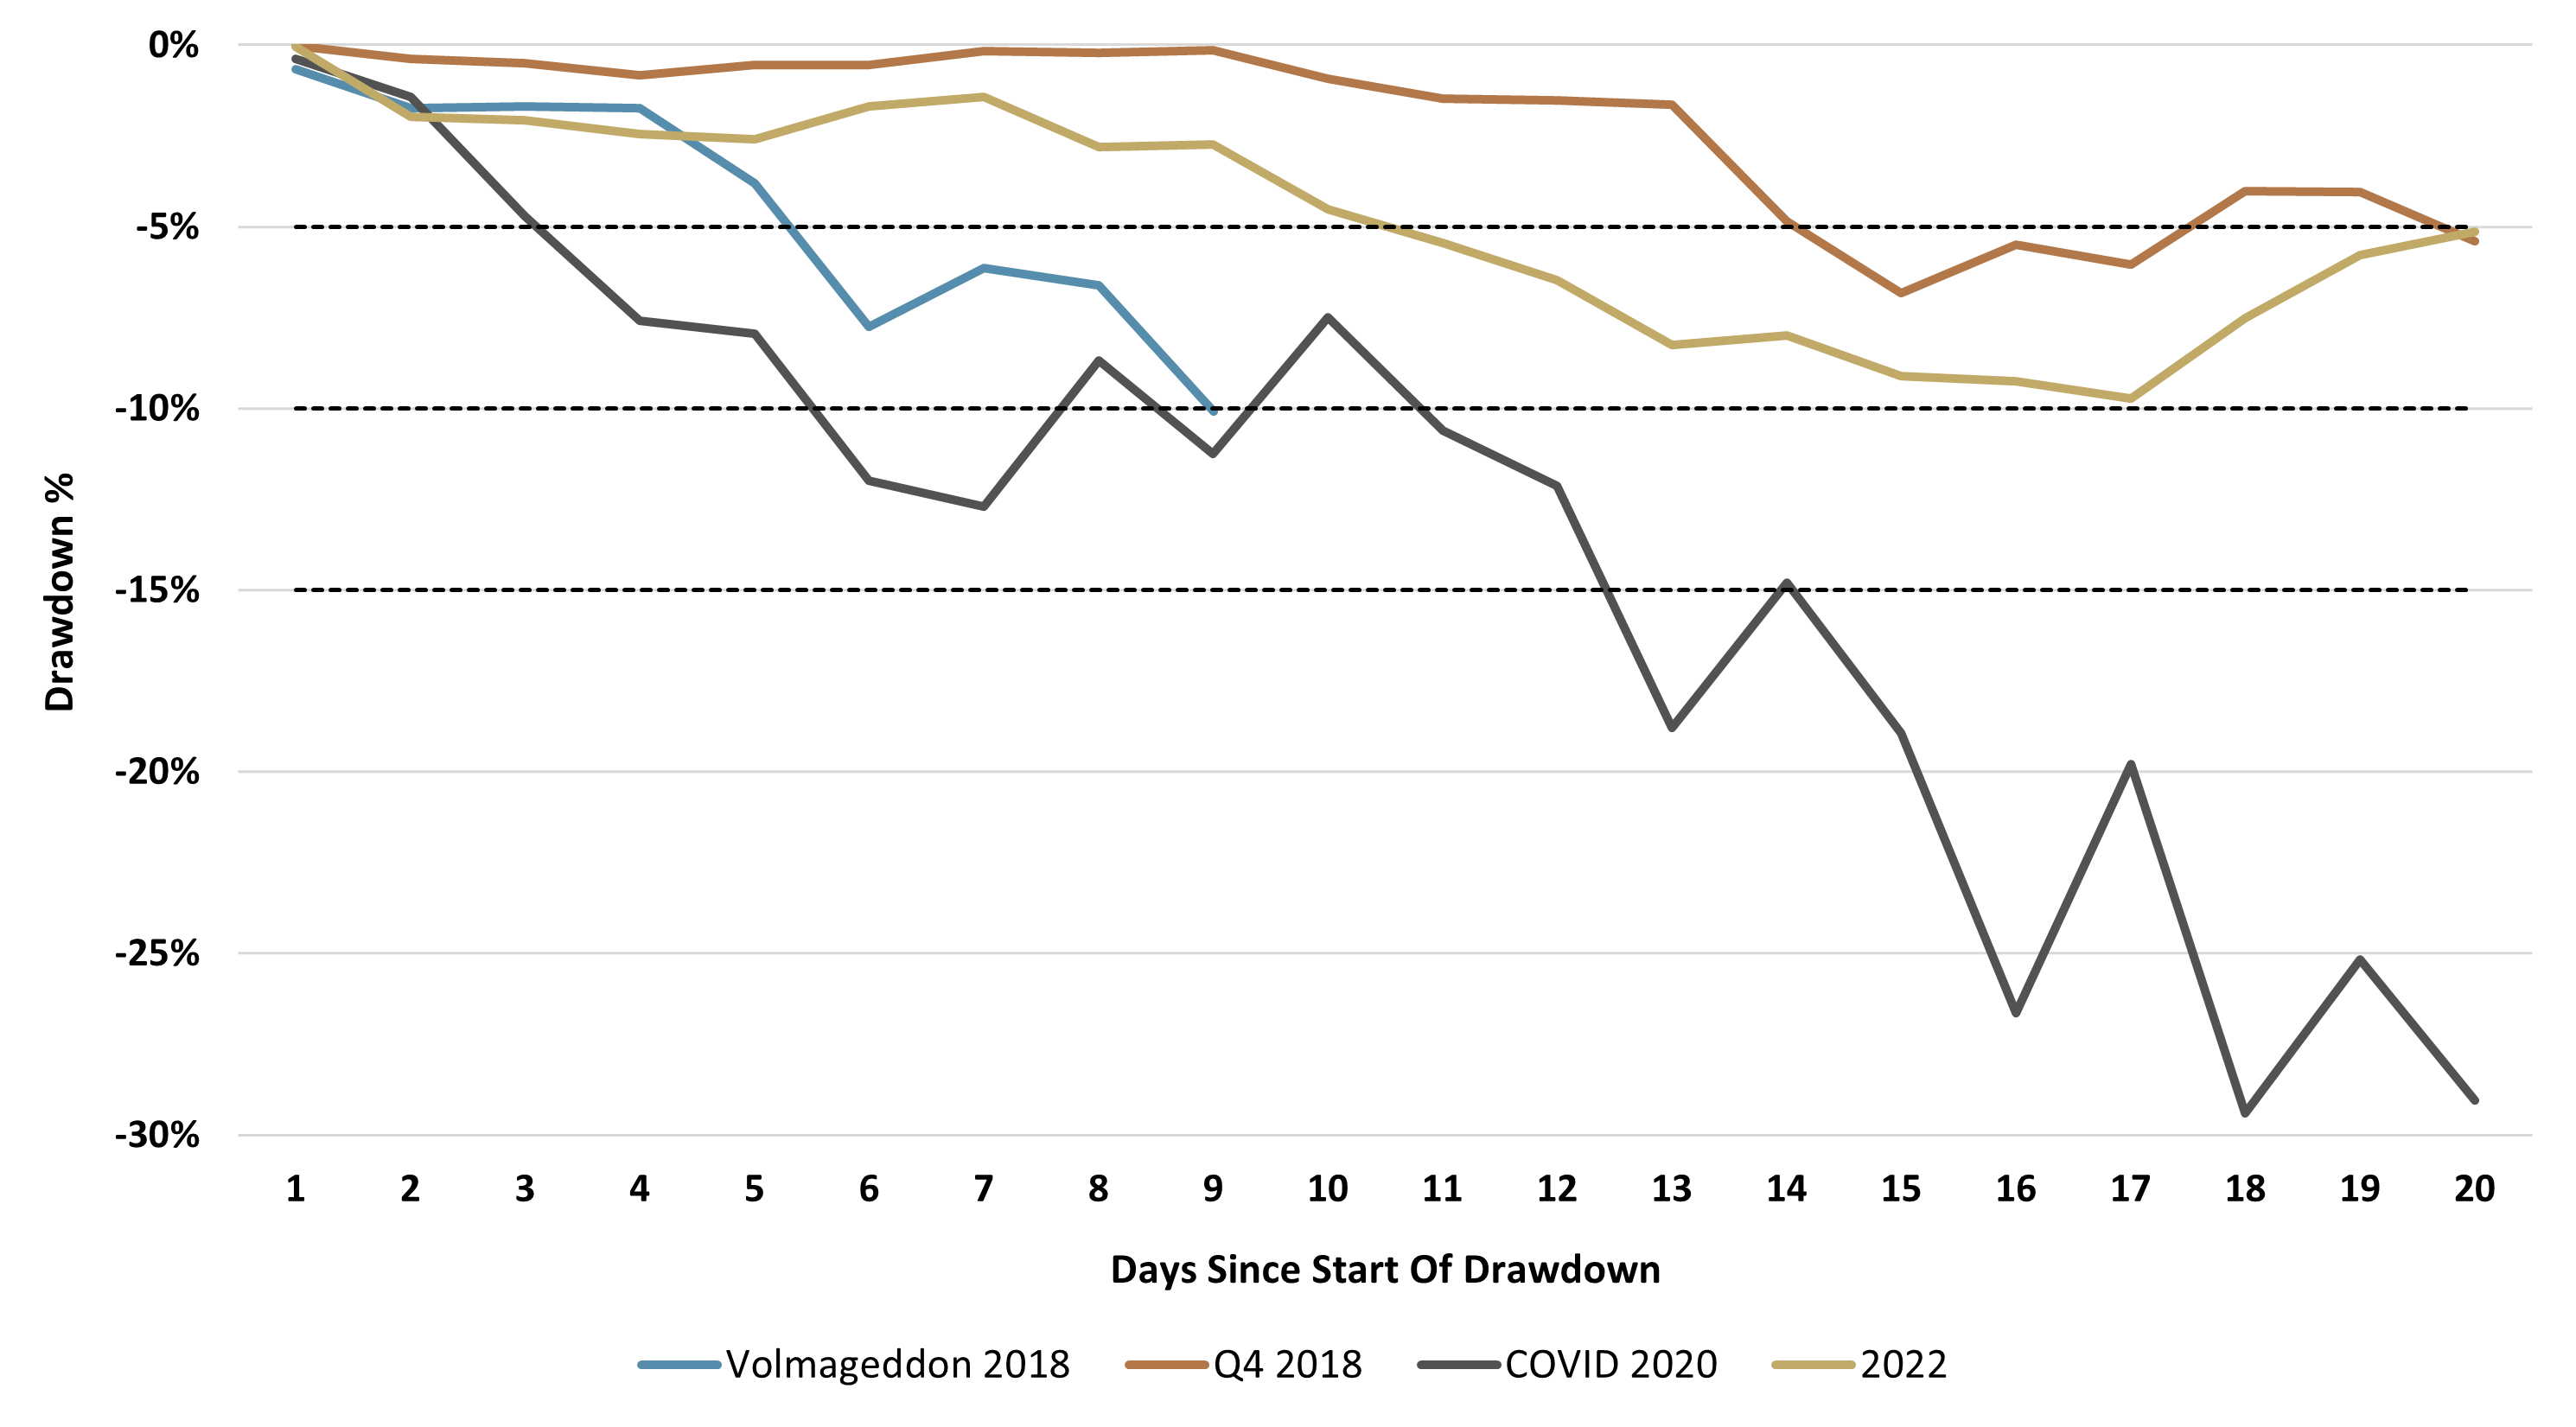
Let’s look at the four largest equity market drawdowns of the last six years (Volmageddon 2018, Q4 2018, COVID 2020, and 2022) to put the current volatility environment into historical perspective. To this end, we will answer the question: For a 1-month move down of 5%, 10%, or 15%, how much more notional protection can a simple long OTM put could get us today relative to those other times in history?
Figure 3: First Trading Month of the Four
Largest Equity Market Drawdowns Since 2018Source: Bloomberg, Simplify Asset Management
Figure 3 above shows the first trading month of these drawdowns. As we can see, they had different magnitudes at different times, but they all fell at some point below 5%, 10%, or even 15% in the first four weeks. If we ignore the complexity of monetization timing, we could assume entering a long put at the start of these periods could have helped mitigate the down move to some extent.
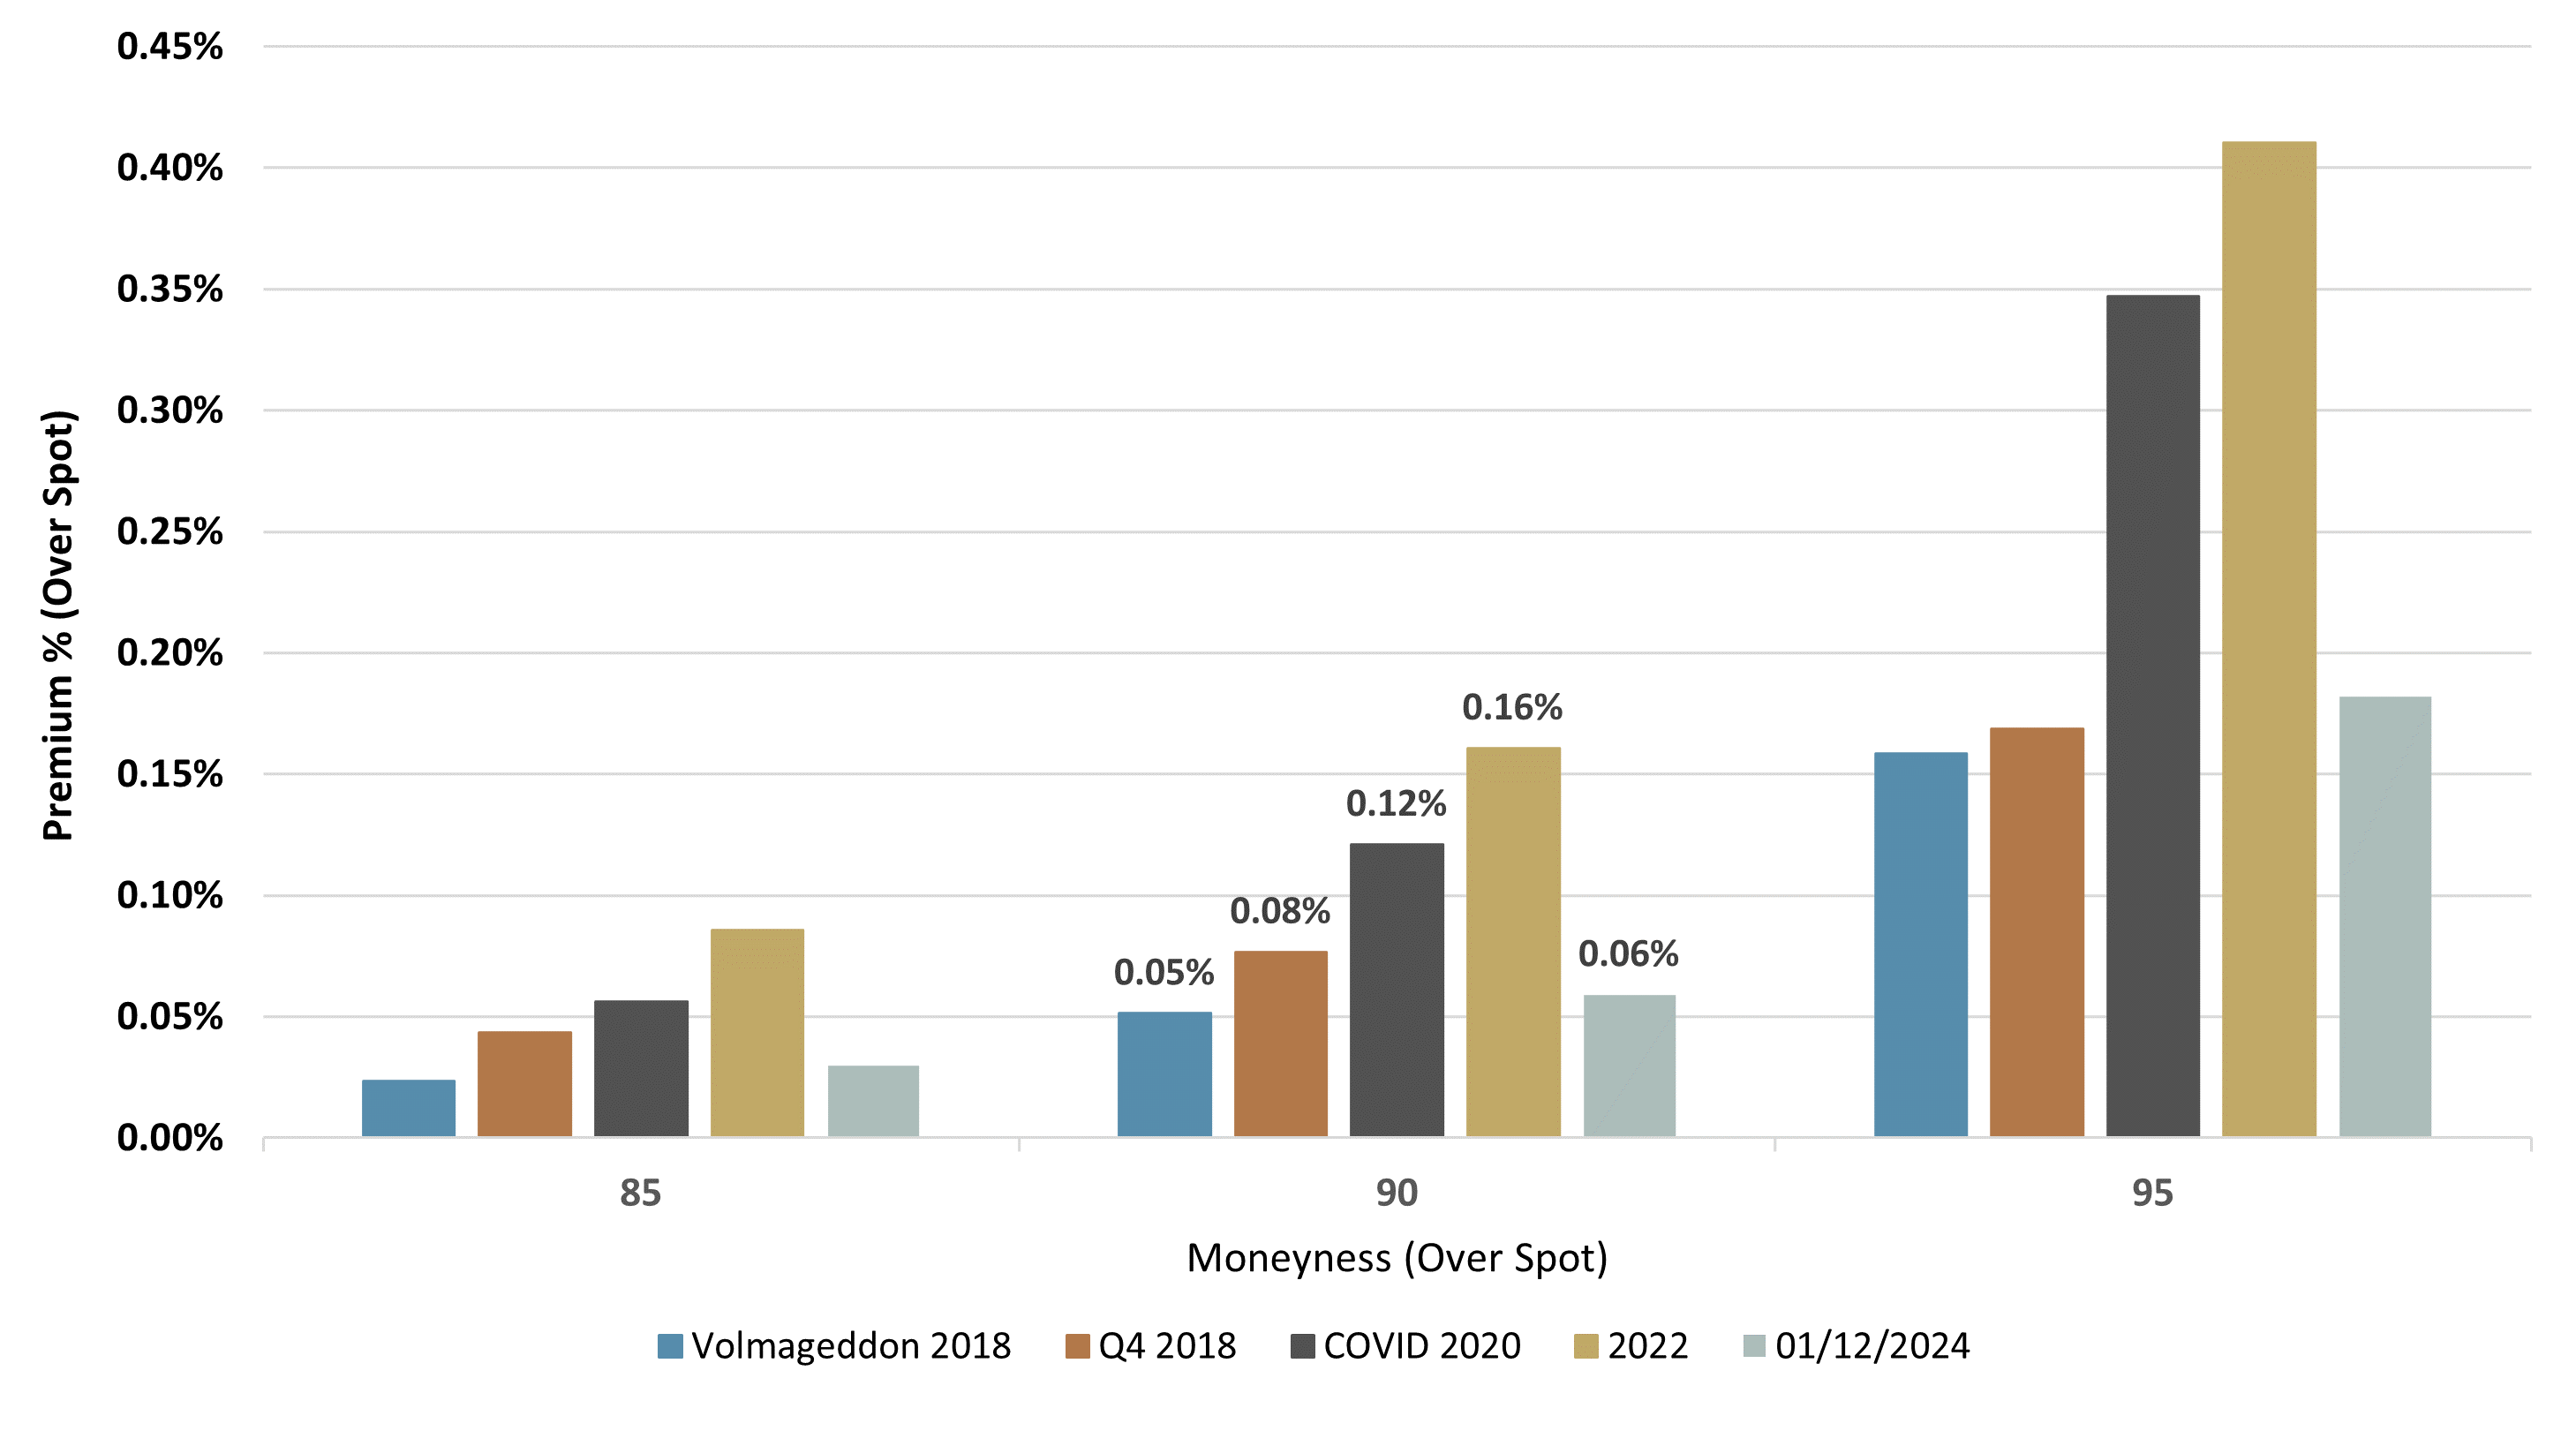
However, the cost of this insurance was very different for each time in history, and as Figure 4 below shows, the current volatility environment is one of the most beneficial ones for this type of equity hedging overlay in terms of initial coverage. In particular, covering 100% notional with a 10% OTM put would cost today half as much as at the start of the COVID 2020 drawdown, and almost three times cheaper than in January 2022.
Figure 4: Cost of 1-Month SPX Puts at 100% of Notional
at the Start of Each Drawdown for Different Moneynesses Source: Bloomberg, Simplify Asset Management
GLOSSARY:
Contango: A situation where the futures price of an asset is higher than the spot price. This results in an upward-sloping forward curve.
Moneyness: Describes the intrinsic value of an option's premium in the market. A contract is either “in the money”, “out of the money”, or “at the money”. A call option is said to be “in the money” when the future contract price is above the strike price. A call option is “out of the money” when the future contract price is below the strike price.
Option: An option is a contract that gives the buyer the right to either buy (in the case of a call option) or sell (in the case of a put option) an underlying asset at a pre-determined price ("strike") by a specific date ("expiry"). An "outright" is another name for a single option leg. A "spread" is when options are bought at one strike and an equal amount of options are sold at a different strike, all at the same expiry.
VIX Index: A real-time market index representing the market's expectations for volatility over the coming 30 days.
Register for Simplify's Investor Hub
In-depth case studies provide valuable insights into practical portfolio problems and their solutions
Simplify curated model portfolios that show investors how to incorporate alternatives into their portfolio
Stay up-to-date with our latest thoughts on markets via our weekly market commentaries