
Share
March 2026 marks a milestone worth noting: the Simplify Managed Futures Strategy ETF (CTA) hits its four-year track record. In a market environment that has tested nearly every assumption in traditional portfolio construction, that's a meaningful moment to take stock of what the strategy was built to do and whether it delivered.
And deliver, it has! From inception on March 7, 2022 through February 28, 2026, CTA has delivered investors:

The performance data quoted represents past performance and is no guarantee of future results. Current performance may be lower or higher than the performance data quoted. Investment returns and the principal value of an investment will fluctuate so that an investor’s shares, when redeemed, may be worth more or less than their original cost. For performance data current to the most recent month-end please call (855) 772-8488 or go to simplify.us/etfs. For standardized performance, go to simplify.us/etfs/cta-simplify-managed-futures-strategy-etf.
Diversifiers are often cast aside for their inability to boost portfolio returns. Sure, they diversified, but if that’s all they did, they often feel like opportunity costs as investors seek return! We believe CTA helped to provide both returns and diversification benefits. The “Have your Cake and Eat it Too” type of solution that historically delivered diversification WITH attractive absolute returns.
The Problem CTA Was Designed to Solve
The post-2020 macro landscape hasn't been kind to the classic 60/40 portfolio. Stock-bond correlations have turned positive, inflation has proven stickier than expected, and the strategy that investors relied on for decades has eroded significantly. When both stocks and bonds sell off at the same time (does 2022 ring a bell?), investors are left without a true hedge.
CTA was built specifically for this environment.
The fund seeks to deliver three things:
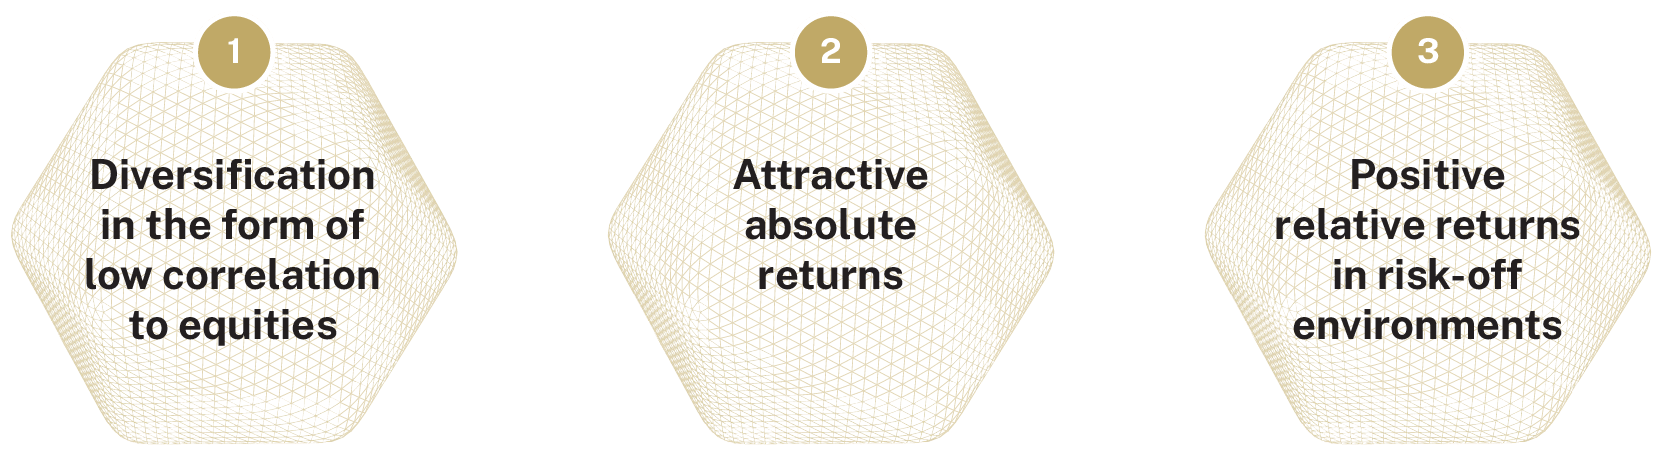
It does this by dynamically adjusting between long and short positions across 50+ commodity and interest-rate futures markets daily, using institutional-grade algorithms developed by the hedge fund provider, Altis Partners.
What the Four-Year Track Record Shows
The numbers tell a compelling story.
CTA has delivered strong absolute returns. From inception through 02/28/26, CTA's NAV total cumulative return was 51.52%, translating to an annualized return of 11.01%. For context, the SG CTA Index, the benchmark for the managed futures category, returned just 3.16% annualized over the same period.
A more commonly referenced benchmark for adding alternatives is often the 60/40 portfolio, which CTA has also outperformed annually by +1.42% - showcasing that it is not only a strong portfolio diversifier with negative correlation, but it can also help to improve total portfolio performance.
Figure 1: Total Returns: CTA, SG CTA Index, and 60/40 Portfolio (03/07/22 - 02/28/26)

Adding CTA improved portfolio outcomes across the board. A portfolio that replaced 10% of core bonds in a 60/40 with CTA (60% S&P 500 Index / 30% Bloomberg US Aggregate Bond Index/ 10% CTA) outperformed the traditional benchmark on every key metric over the four-year period:
Figure 2: Key Statistics (03/07/22 - 02/28/26)
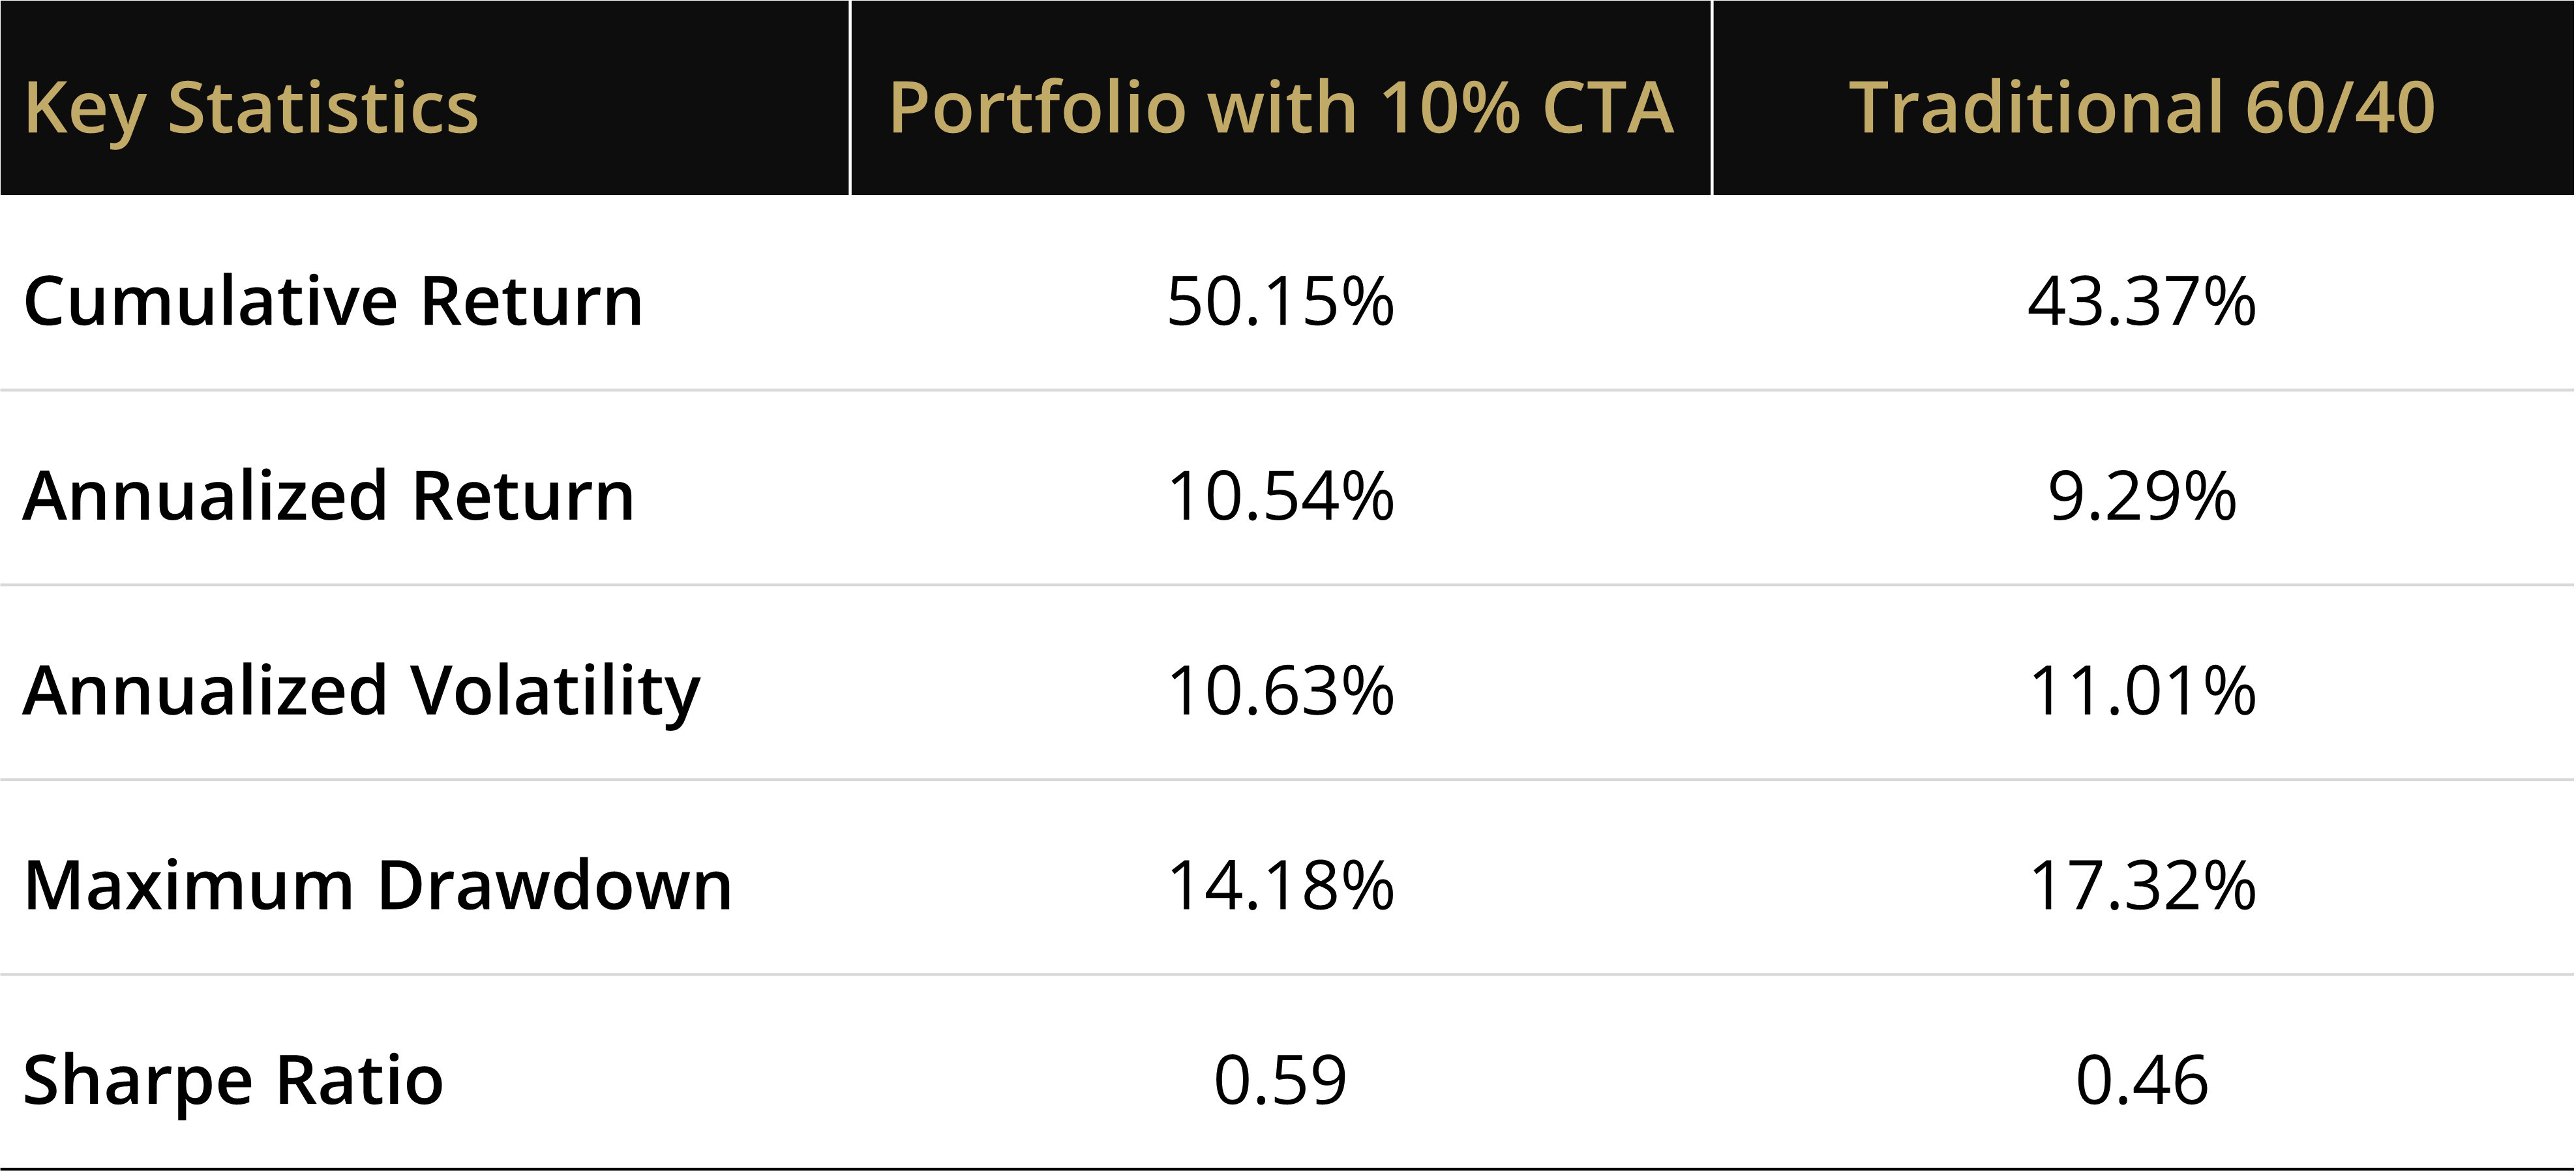
More return, less volatility, and a shallower maximum drawdown. That's a rare combination in portfolio construction with such a small allocation tweak.
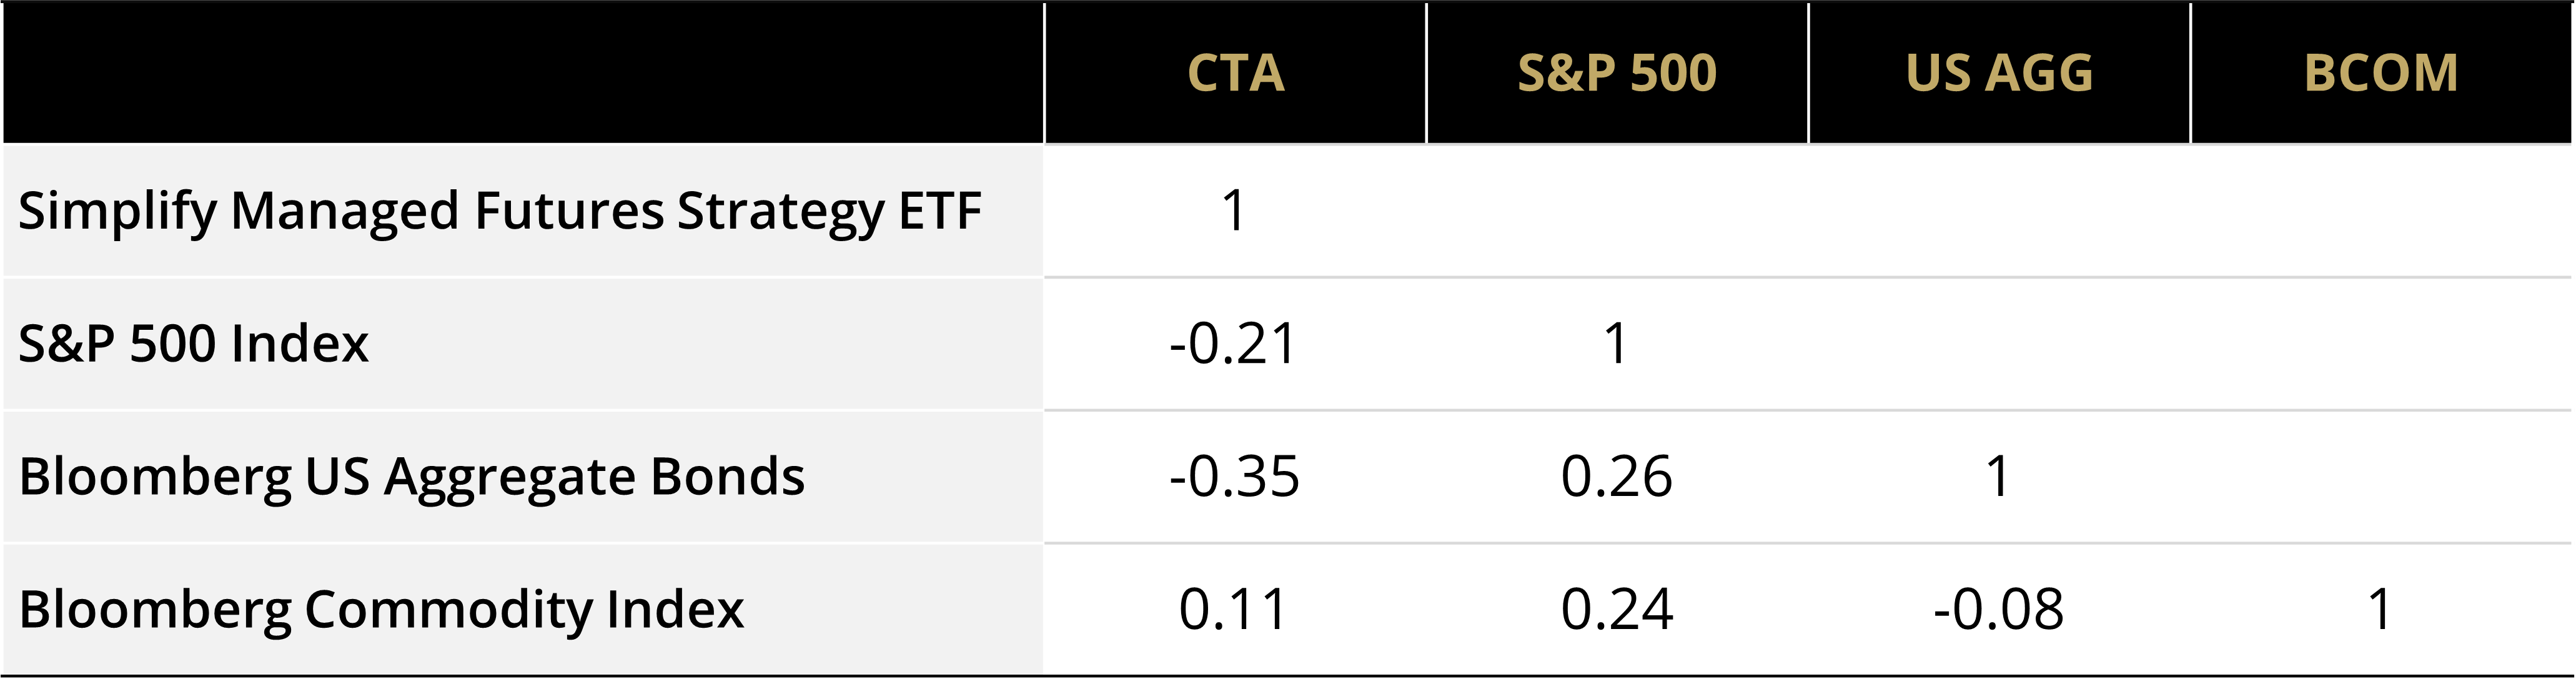
The correlation profile is genuinely differentiated. Since inception, CTA has maintained a -0.10 correlation to the S&P 500 Index and -0.36 correlation to the Bloomberg US Aggregate Bond Index. In an environment where stocks and bonds themselves have shown a +0.17 correlation to each other, CTA has served as a true diversifier, not just in theory, but in practice.
Figure 3: Correlations (03/07/22 - 02/28/26)
CTA hedged when it mattered most. An asymmetric return profile—better downside mitigation without sacrificing upside—is exactly what the strategy was designed to deliver.
- In months when the S&P 500 Index had a negative return, CTA posted an average +2.40% return.
- In months when the S&P 500 Index had a positive return, CTA also had a positive return, averaging +0.39%.
Source: Bloomberg, Simplify Calculations. Data from 03/07/22 through 02/28/26.
What Makes CTA Different
Not all managed futures strategies are built alike. CTA's differentiated process combines a core trend-following model with additional signals designed to enhance diversification, increase nimbleness, optimize position sizing, and aim for reduced drawdown risk. The models are evaluated and can be repositioned daily, allowing the strategy to adapt to shifting market regimes in real time.
The result is institutional-caliber execution—powered by Altis Partners' hedge fund algorithms—delivered in a daily liquid ETF with full transparency at a 0.75% gross expense ratio.
Four Years In, the Case Remains Strong
The macro backdrop that made CTA relevant in 2022 hasn't gone away. Positive stock-bond correlations, elevated inflation sensitivity, and geopolitical uncertainty aren't going anywhere quickly. For advisors building portfolios designed to hold up across regimes—not just in bull markets—the four-year track record of CTA makes a strong case for a dedicated managed futures allocation.
The data has spoken. The diversification worked. The returns were there. And the strategy did what it said it would do when it mattered most.
Past performance is not a guarantee of future results. The performance data quoted represents past performance as of 02/28/2026. Investment returns and principal value will fluctuate. For standardized performance, visit simplify.us/etfs/cta-simplify-managed-futures-strategy-etf. The gross expense ratio of CTA is 0.75%. Investors should carefully consider investment objectives, risks, charges, and expenses before investing. An investment in the fund involves risk, including possible loss of principal.
GLOSSARY
Annualized Volatility: Measures how much a stock price varies over one year.
Bloomberg US Aggregate Bond Index: A broad-based flagship benchmark that measures the investment grade, US dollar-denominated, fixed- rate taxable bond market. The index includes Treasuries, government-related and corporate securities, MBS (agency fixed-rate pass-throughs), ABS and CMBS (agency and non-agency).
Bloomberg US EQ:FI 60:40 Index (BBg 60/40): Designed to measure cross-asset market performance in the US. The index rebalances monthly to 60% equities and 40% fixed income. The equity and fixed income allocation is represented by Bloomberg US Large Cap (B500T) and Bloomberg US Agg (LBUSTRUU) respectively.
Bloomberg US Large Cap Index: A float-market-cap-weighted benchmark tracking the performance of the 500 most highly capitalized, investable companies in the US equity market. It acts as a comprehensive, real-time indicator for the performance of large-sized US companies.
Futures: Derivative financial contracts that obligate parties to buy or sell an asset at a predetermined future date and price. The buyer must purchase or the seller must sell the underlying asset at the set price, regardless of the current market price at the expiration date.
Futures Contract: A legal agreement to buy or sell a particular commodity asset, or security at a predetermined price at a specified time in the future. Futures contracts are standardized for quality and quantity to facilitate trading on a futures exchange.
Maximum Drawdown: The maximum observed loss from a peak to a trough of a portfolio, before a new peak is attained. Maximum drawdown is an indicator of downside risk over a specified time period.
S&P 500 Index: The index includes 500 leading U.S. large cap companies and captures approximately 80% coverage of the available market.
SG CTA Index (SocGen CTA): Provides the market with a reliable daily performance benchmark of major commodity trading advisors (CTAs). Calculates the net daily rate of return for a group of 20 CTAs selected from the largest managers open to new investment. The SG CTA Index is equal-weighted and reconstituted annually and has become recognized as the key managed futures performance benchmark.
Sharpe Ratio: The ratio compares the return of an investment with its risk. It’s a mathematical expression of the insight that excess returns over a period of time may signify more volatility and risk, rather than investing skill.

