

Share

Introduction
The fixed income market has been challenging to navigate the past couple of years as supply shocks have pushed yields higher. The move higher in rates initially had a negative impact on fixed income investors as bond prices declined when rates moved higher due to their inverse relationship; however, the higher yields offer more income potential and help offset potential price losses in the future. Once these supply shocks normalized to some extent, rates have mean-reverted to the middle of the range, although within a much wider range more recently. So, what is a fixed income investor to do? One way to capitalize on a range-bound, yet volatile Treasury market is via structural alpha by selling options on U.S. Treasuries as convexity risk becomes more compelling.
Current Macro Outlook for Federal Reserve Policy and Rates Market
At the highly anticipated June FOMC (Federal Open Market Committee) meeting, the financial markets heard the first press conference from new Federal Reserve (FED) Chairman Kevin Warsh. The biggest takeaway for most market participants likely was the hawkish pivot with the removal of the “easing bias” language in the policy statement and the new quarterly Dot Plot, which previously had one cut, now showing one hike for 2026. However, the Kevin Warsh era started with a bang with a sharply reduced policy statement, him not submitting a dot in the Dot Plot, and stating the removal of forward guidance.
Chair Warsh quickly delivered on his promise to reduce the FED’s communications and announced one of his five new task forces will focus on communications such as the Summary of Economic Projections (SEPs), including the Dot Plot, as well as press conferences, statements, and meeting minutes. A Warsh-led FED with less communication will increase bond market volatility in the near term due to less forward guidance and is likely to mean a wider distribution of policy outcomes. The potential increased volatility in the bond market may continue the recent trend of volatile, yet range-bound Treasuries, although in wider ranges.
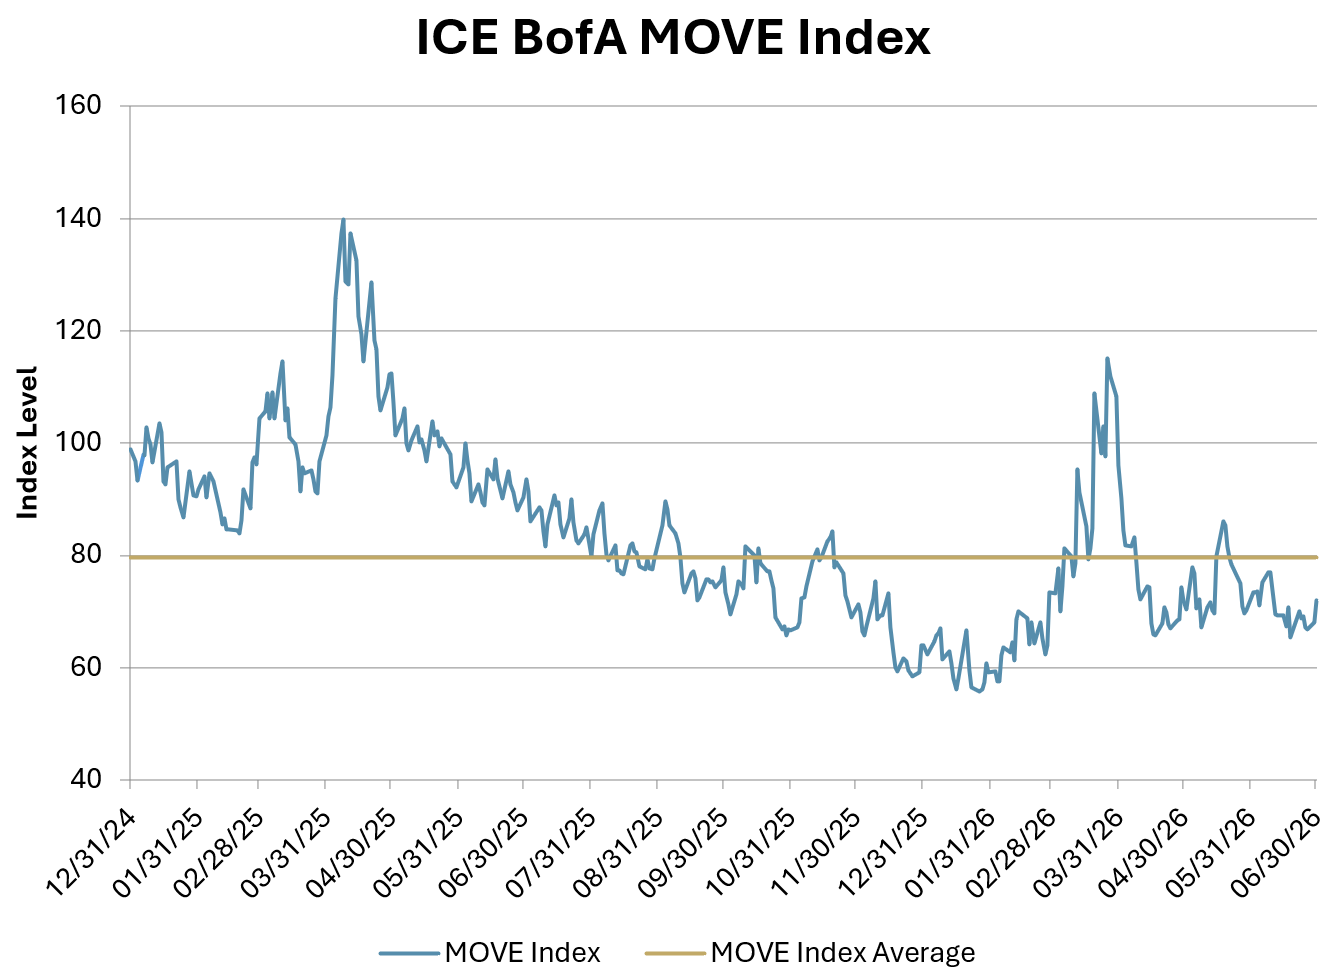
Over the past couple of years there have been two extreme supply shocks causing interest rate volatility to spike, the Tariff Tantrum in April 2025 and the energy price spike due to the Iran war starting in March 2026. This is reflected in the ICE BofA MOVE Index, the primary measure of U.S. bond market volatility, and shows the bond market continuing to have bouts of volatility in recent years; however, it has normalized rather quickly (see Figure 1).
A way to capitalize on a potentially volatile, yet range-bound Treasury market is through volatility harvesting by selling options on U.S. Treasuries. By selling out-of-the-money options at key rate levels, an investor can potentially generate additional income while positioning for adding or reducing risk at high reward to risk junctures. These are mean reversion strategies in range-bound markets, so when rates stabilize and resume the path in the middle of the range, any higher volatility levels will increase premiums on options and provide an even more attractive environment for harvesting volatility. This should increase yields in the near term and total return in the long run. With the FED’s recent change in communications, we expect fixed income short volatility trades to potentially have a tailwind in the coming year.
Figure 1: MOVE Index Levels from 12/31/24 to 06/30/26
Risk-Managed Options Writing Strategy
Treasury options are in high demand to hedge out interest rate risk by broker dealers, especially those involved with Mortgage-Backed Securities (MBS). This strong structural demand to buy options naturally increases option premiums, adding to the potential profitability of option selling strategies. By selling out-of-the-money options at key rate levels, Treasury option selling strategies generate additional income while positioning for adding or reducing risk at high reward to risk junctures.
Strike prices are typically selected out-of-the-money and laddered for diversification. Additionally, option durations are short, typically one to two months to expiration. Finally, risk management procedures will typically ladder various strikes and expiries for diversification and manage risk strategically by entering and exiting tactically. The portfolio management team keeps an eye on the realized volatility and exits positions when the MOVE Index’s volatility looks sustainably high.
Simplify Treasury Option Strategies
Simplify offers two ETFs that utilize the Treasury option selling strategy:
Enhanced Income in a Treasury Bill Fund
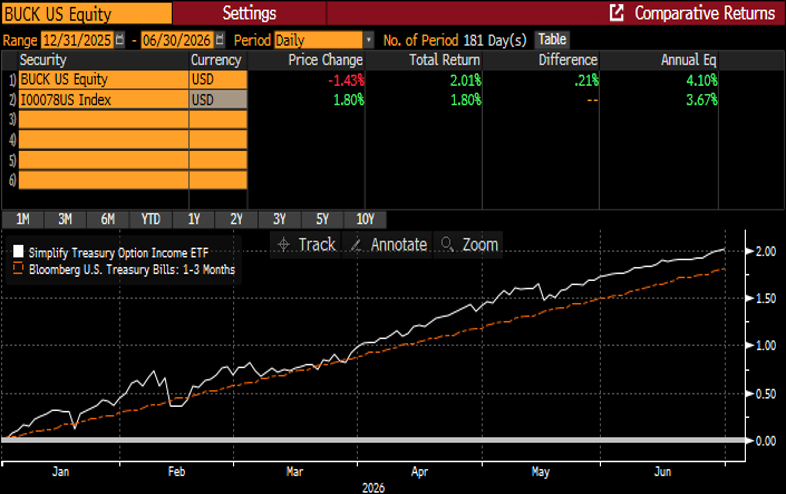
BUCK is an enhanced Treasury Bill fund. It seeks to maximize Treasury Bill total returns while targeting a duration of one year or less and additionally seeks to enhance income via structural alpha by selling options on U.S. Treasuries. The fund is actively managed, investing at least 80% of its net assets in U.S. Government securities with a duration up to one year, and seeks to enhance income through the risk-managed option selling strategy. The risk-managed options writing strategy is designed to provide additional income as well as add to the ETF’s total returns. The additional income has added to BUCK’s total returns YTD, outperforming the Bloomberg U.S. Treasury Bill: 1-3 Months Index as of 06/30/26 (see Figure 2).
Figure 2: BUCK vs. Bloomberg U.S. Treasury Bills: 1-3 Months Index
Enhanced Income in a Core Bond Fund
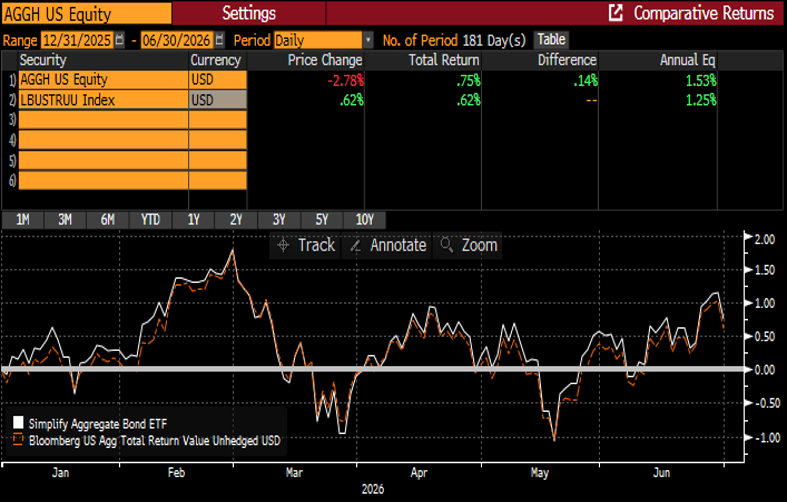
AGGH is an enhanced version of the Bloomberg U.S. Aggregate Bond Index. It seeks higher income while also maximizing total return with similar risk profile as the U.S. Aggregate Bond Index. The additional income has added to AGGH’s total returns YTD, outperforming the U.S. Aggregate Bond Index as of 06/30/26 (see Figure 3). The fund is actively managed to create a core bond exposure with potential enhanced income via structural alpha opportunities such as more efficient option writing and curve positioning. The investment process is designed to emphasize bonds with the highest risk-adjusted yields, use Treasury futures to set target duration, and enhance yield with a risk-managed options selling strategy on U.S. Treasury securities.
Figure 3: AGGH vs. Bloomberg U.S. Aggregate Bond Index
In Conclusion
The FED has pivoted to a more hawkish stance with less communication due to a resilient economy, stabilizing labor market, and inflation still well above its 2% target, with the ‘high for longer’ narrative likely keeping them on hold. This should potentially lead to rates staying range-bound, yet expected to be volatile within the range, as we have seen over the past couple of years, creating opportunities to optimize convexity risk premium via option selling. Most fixed income strategies enhance income via credit risk; however, that is not very compelling right now given that credit spreads are at historically tight levels. Convexity risk is more compelling, and both BUCK and AGGH seek to monetize the premium in an optimal way. Investors looking to diversify their fixed income allocation while seeking the highest total returns with enhanced income and mitigated credit risk should consider an investment in either strategy depending on their duration preference.
GLOSSARY
Alpha: Investment returns generated through active management or investment skill, rather than from general market movements.
Beta: A portfolio's exposure to the performance of a market or benchmark.
Bloomberg U.S. Aggregate Bond Index: A broad-based benchmark that measures the investment grade, US dollar-denominated, fixed-rate taxable bond market.
Bloomberg U.S. Treasury Bills: 1–3 Months Index: An index that measures the performance of public obligations of the U.S. Treasury that have a remaining maturity of greater than or equal to 1 month and less than 3 months.
Convexity Risk: The risk that a bond's price sensitivity to interest rate changes may vary as rates move. This risk can create opportunities for option-based strategies.
Credit Risk: The risk that a bond issuer may fail to make interest or principal payments as promised.
Credit Spread: The additional yield investors require to own a bond with credit risk instead of a comparable U.S. Treasury security.
Duration: A measure of a bond's sensitivity to changes in interest rates. Generally, bonds with higher duration are more sensitive to rate movements.
Hawkish: A term used to describe a monetary policy stance that prioritizes controlling inflation and may favor higher interest rates.
ICE BofA MOVE Index (MOVE Index): This index is a measure of U.S. interest-rate volatility that tracks the movement in U.S. Treasury yield volatility implied by current prices of one-month over-the-counter options on two-, five-, 10- and 30-year Treasuries.
Mean Reversion: The tendency of a market variable, such as interest rates, to move back toward its historical average over time.
Option: A financial contract that gives the buyer the right, but not the obligation, to buy or sell an asset at a specified price before a specified date.
Option Premium: The amount paid by an option buyer and received by an option seller for the rights provided by the option contract.
Out-of-the-Money Option: An option with a strike price that is less favorable than the current market price of the underlying security.
Range-Bound Market: A market that trades within a relatively defined upper and lower range rather than trending strongly higher or lower.
Structural Alpha: Additional return generated by capturing persistent market opportunities, such as option premiums, rather than taking additional credit risk.
Volatility: The degree to which market prices fluctuate over time.
Volatility Harvesting: An investment approach that seeks to generate additional income by selling options and collecting option premiums.
Yield: The income earned from an investment, typically expressed as an annual percentage of its value.
Yield Curve: A graphical representation of yields across different maturities of similar-quality bonds, often U.S. Treasuries.