
Share
Introduction
The front-end of the yield curve has been somewhat on hold as the Federal Reserve Bank (FED) takes a cautious and patient approach to adjusting monetary policy lower as they wait to see how trade negotiations continue to evolve. The back-end of the yield curve continues to remain elevated as the potential inflationary impact from tariffs is assessed by the bond market, as well as growing concerns over the sustainability of the fiscal path of the U.S. economy with such a large federal deficit. This has led to the intermediate part of the yield curve outperforming this year, and Simplify has a solution to take advantage of positioning on that point of the curve.
Simplify Intermediate Term Treasury Futures Strategy ETF
The Simplify Intermediate Term Treasury Futures Strategy ETF (TYA) is a rather simple approach to investing in the intermediate part of the yield curve sized in an amount that gives it longer-term Treasury duration. The ETF has about 3 times exposure to the 10-year U.S. Treasury Note, giving it a duration of about 16 to 20 years, with the benchmark the ICE U.S. Treasury 20+ Year Index. The strategy combines a core portfolio of mostly U.S. Treasury Bills as collateral and actively traded 10-year U.S. Treasury Note Futures contracts. TYA is systematically managed, which means Simplify is not making any bets on the direction of interest rates, and futures contracts are rolled quarterly as they approach expiration.
The Belly of the Yield Curve Looks Most Attractive Right Now
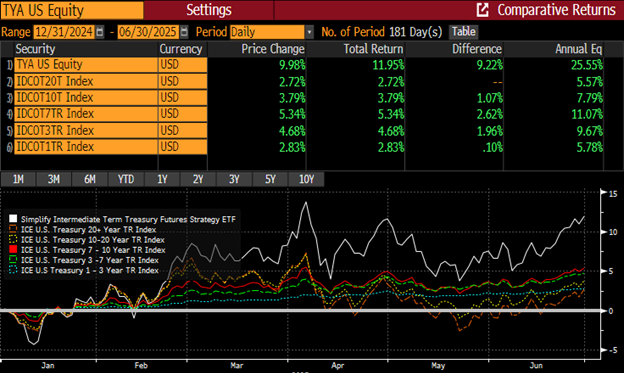
The intermediate part (or belly) of the yield curve has become the most attractive part of the curve, outperforming this year, with TYA benefiting from positioning on that point of the curve (see Figure 1). With this continued elevated pressure on back-end rates, we view a levered approach to owning the belly of the yield curve as a better risk-reward opportunity than owning long-dated Treasury bonds outright, while still having a similar duration profile. TYA’s significant duration makes it capital efficient, allowing for a modest allocation for the same long-term duration target, creating more efficient duration exposure.
Figure 1: YTD Returns for TYA and ICE Treasury Bond Indices
In Times of Volatility, the Belly Is the "Sweet Spot" of the Yield Curve
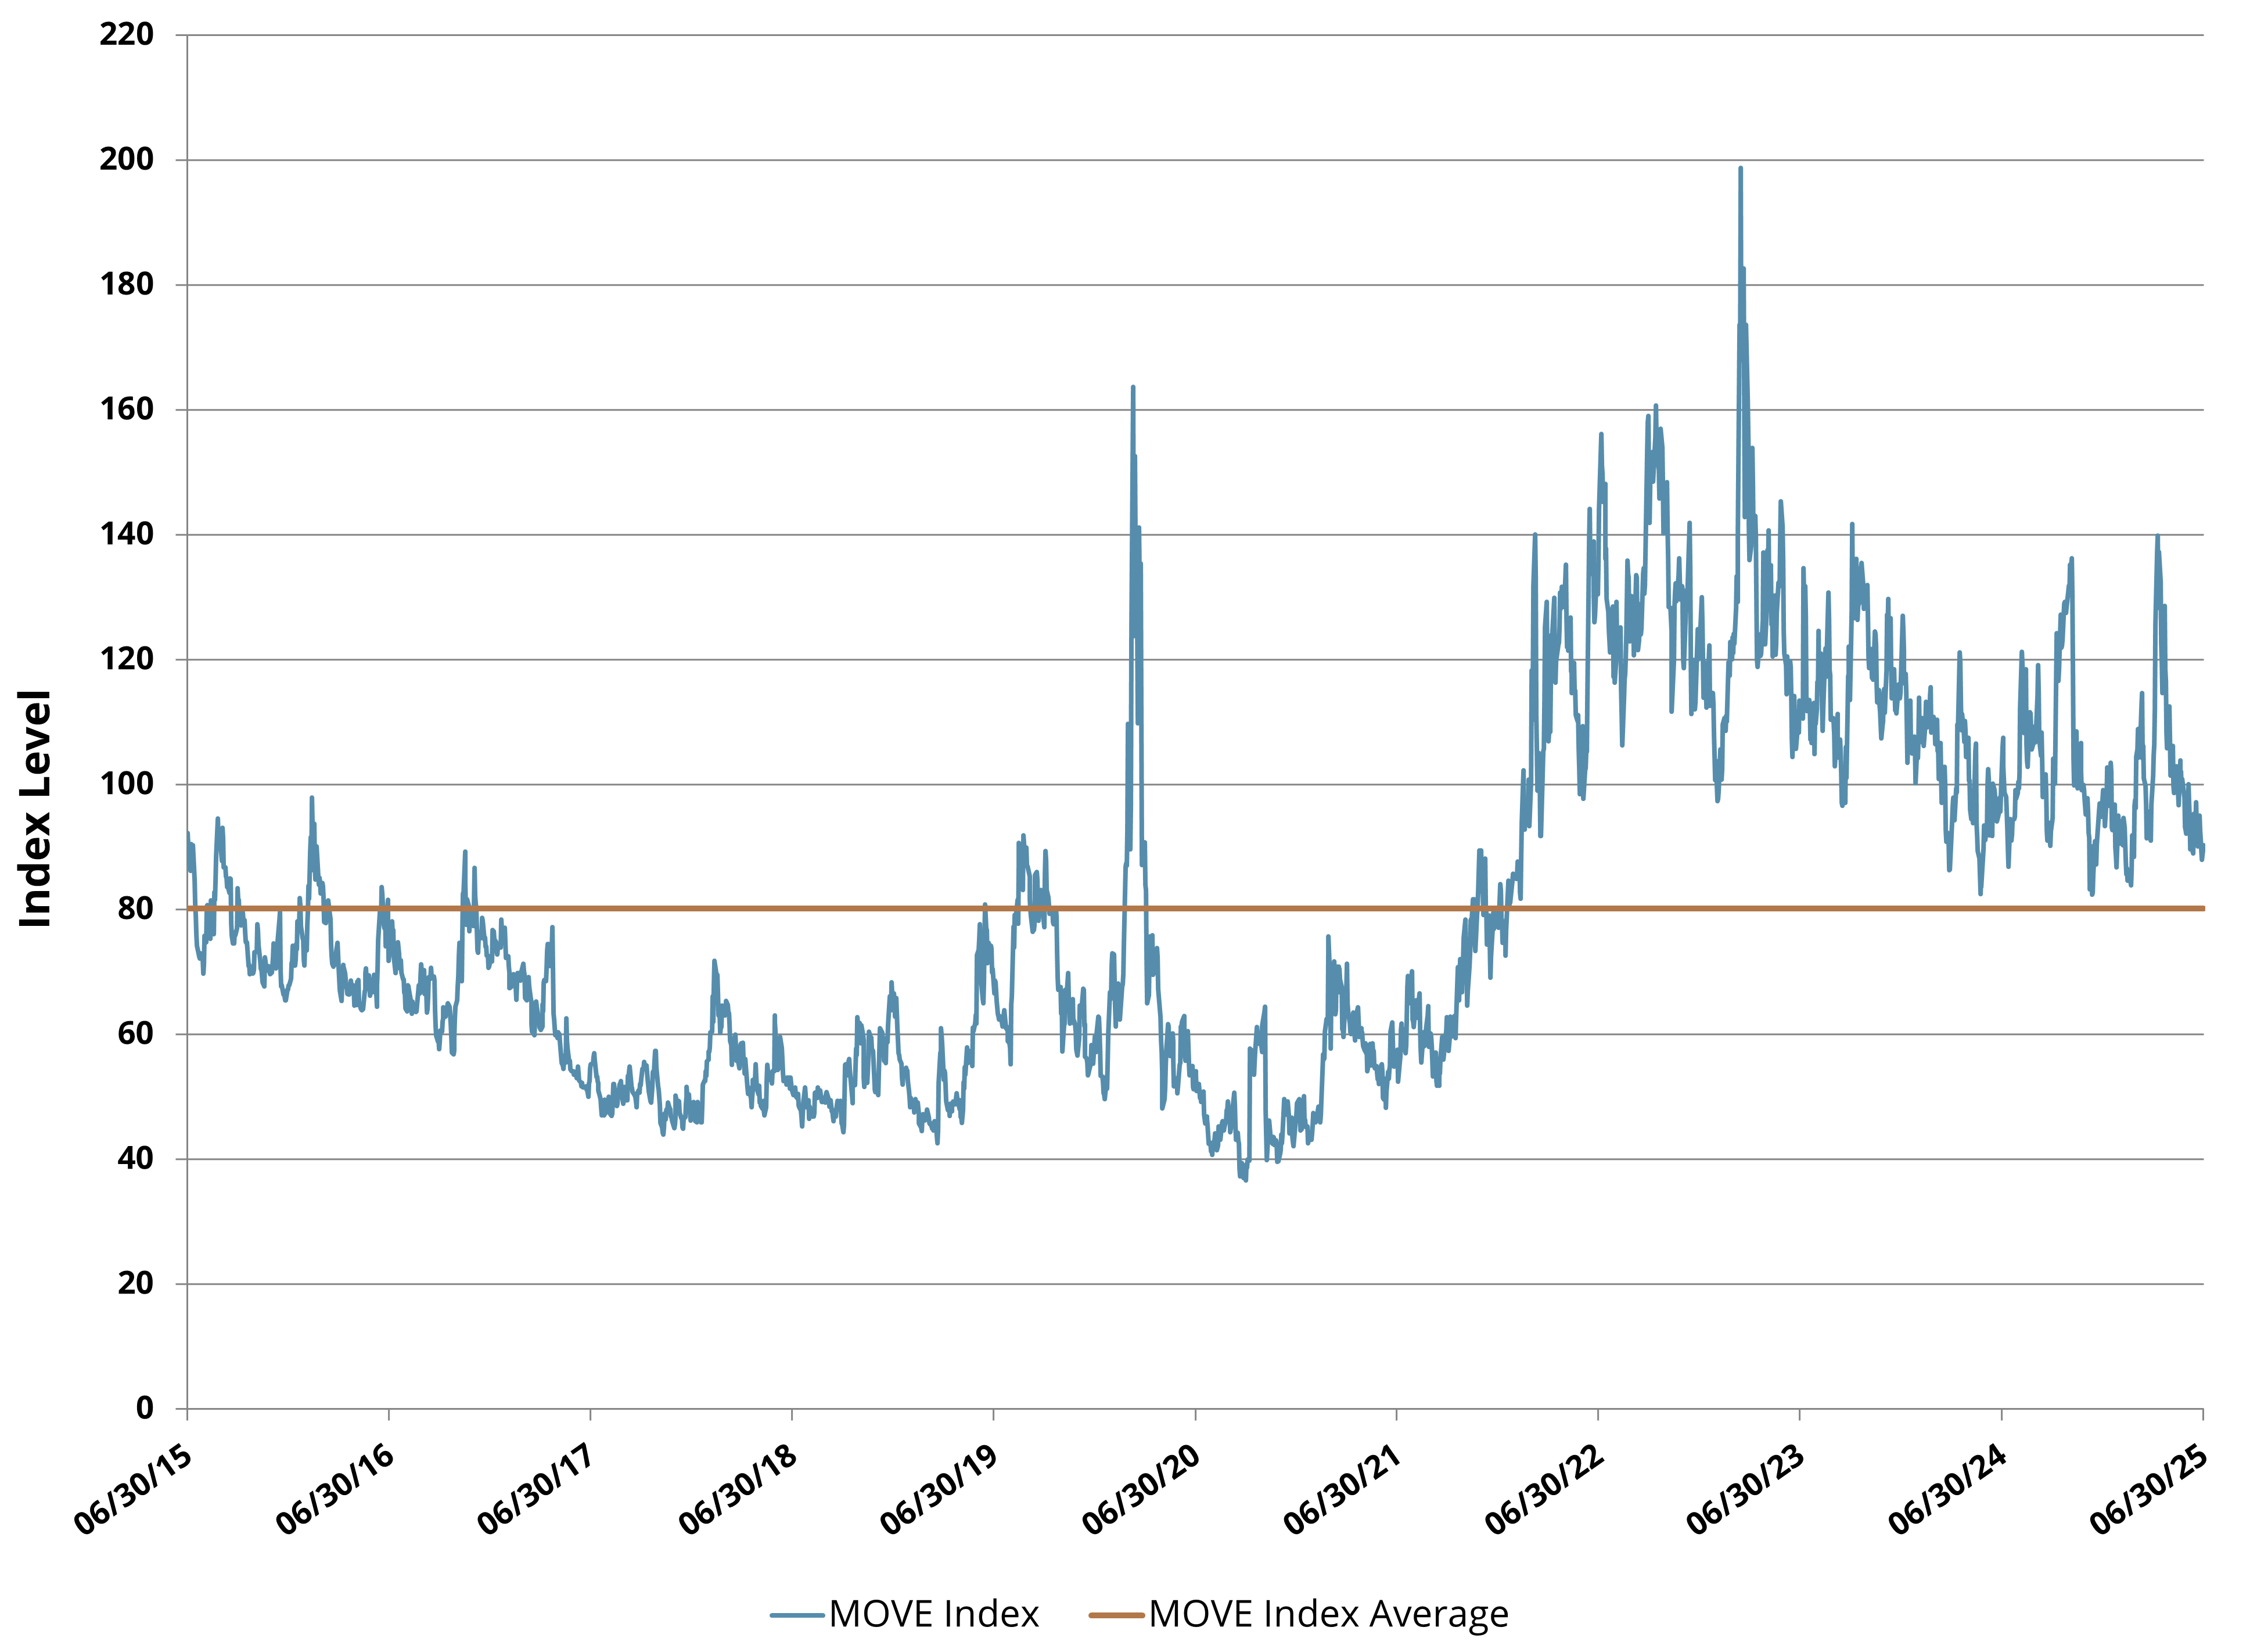
During the Tariff Tantrum in early April, the ICE BofA MOVE Index (created by Simplify’s very own Harley Bassman) surged to almost 140 at the close and intraday reached a level only seen a few other times in history. It has remained elevated in recent years since the FED started raising interest rates in 2022 to tame inflation (see Figure 2). Investors typically would gravitate to the front-end in periods of extreme volatility as a sign that rate cuts are coming; however, the reaction function of the FED is much different in recent years, thus the belly has become a better place to hang out.
Figure 2: Ice BofA MOVE Index Remains Elevated
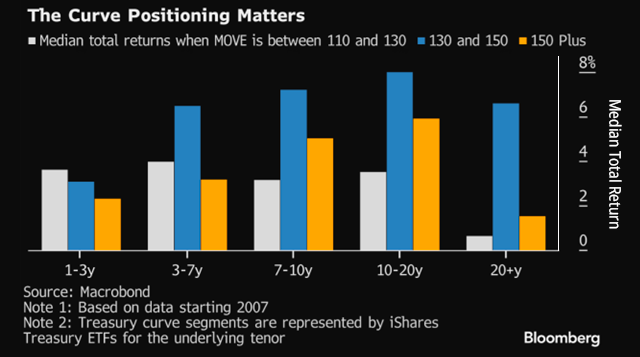
The intermediate parts of the yield curve performed better when the MOVE Index was elevated during periods of extreme volatility (see Figure 3). Performance in the belly was best when volatility levels were in the 130 to 150 range, which looks to be the sweet spot for returns.
Figure 3: Analysis of 1-Year Total Returns of MOVE Index Levels
In Conclusion
With the FED once again staying on hold at their June meeting, the front-end of the yield curve continues to stay in a wait-and-see mode. And although recent successful long-term U.S. Treasury auctions have provided some relief to back-end rates, they remain elevated with continued upward pressure. The belly continues to look the most attractive, and we believe TYA is a good option to express this idea by targeting the intermediate part of the yield curve in a capital-efficient way to get significant duration with only a modest allocation.
GLOSSARY
Duration: A measure of the sensitivity of the price of a bond or other debt instrument to a change in interest rates.
Futures: Derivative financial contracts that obligate parties to buy or sell an asset at a predetermined future date and price. The buyer must purchase or the seller must sell the underlying asset at the set price, regardless of the current market price at the expiration date.
Futures Contract: A legal agreement to buy or sell a particular commodity asset, or security at a predetermined price at a specified time in the future. Futures contracts are standardized for quality and quantity to facilitate trading on a futures exchange.
ICE U.S. Treasury 1–3 Year Total Return Index: Measures the total return of U.S. dollar denominated, fixed rate Treasury securities with remaining maturity greater than 1 year and less than or equal to 3 years. The index is market value weighted and rebalanced at month end; includes price changes and reinvested coupons.
ICE U.S. Treasury 3–7 Year Total Return Index: Tracks the total return of U.S. dollar denominated, fixed rate Treasury bonds and notes with remaining maturity greater than 3 years and up to 7 years. Securities are market value weighted, monthly rebalanced, and total return includes reinvested coupons.
ICE U.S. Treasury 7–10 Year Total Return Index: Captures the total return performance of U.S. dollar denominated, fixed rate Treasury securities with remaining maturity greater than 7 years and up to 10 years. Market value weighted, rebalanced monthly, and total return includes reinvested coupons.
ICE US Treasury 10–20 Year Total Return Index: Is a total-return index that tracks the performance of U.S. Treasury bonds with remaining maturities between 10 and 20 years. It factors in both price changes and reinvested interest income—providing a more comprehensive measure of bond returns than a price-only index.
ICE U.S. Treasury 20+ Year Bond Index: Tracks the performance of US dollar denominated sovereign debt publicly issued by the US government in its domestic market. Qualifying securities must have greater than or equal to twenty years remaining term to final maturity as of the rebalancing date, a fixed coupon schedule and an adjusted amount outstanding of at least $300 million.
ICE U.S. Treasury 20+ Year Total Return Index: Tracks the total return performance of U.S. dollar denominated, fixed rate Treasury bonds with remaining maturity exceeding 20 years. The index is market value weighted, rebalanced at month end, and includes price movements and reinvested interest payments.
MOVE (Merrill Option Volatility Estimate) Index: A measure of expected short-term volatility in the US Treasury bond market.
Yield Curve: A line that plots yields, or interest rates, of bonds that have equal credit quality but differing maturity dates. The slope of the yield curve can predict future interest rate changes and economic activity.

