Fixed Income
Fixed Income
A Credit Hedge You Get Paid to Hold? Understanding Positive Return Expectations for Quality-Junk
Share
Introduction
In our last blog, we introduced a factor-based credit hedge, quality-junk (Q-J), where we mentioned that this particular beta-neutral long/short factor has a positive expected return. In this blog, we present the theoretical underpinning for positive expected drift in long/short factors that buy lower risk assets and short higher risk assets, and show empirical evidence for this drift across a wide range of asset classes. We also explore the implications of this theoretical framework on the dynamics one can expect from Q-J over a market cycle, in particular how this long/short factor can shift from having a steady positive drift to becoming a credit hedge.
Theoretical Framework
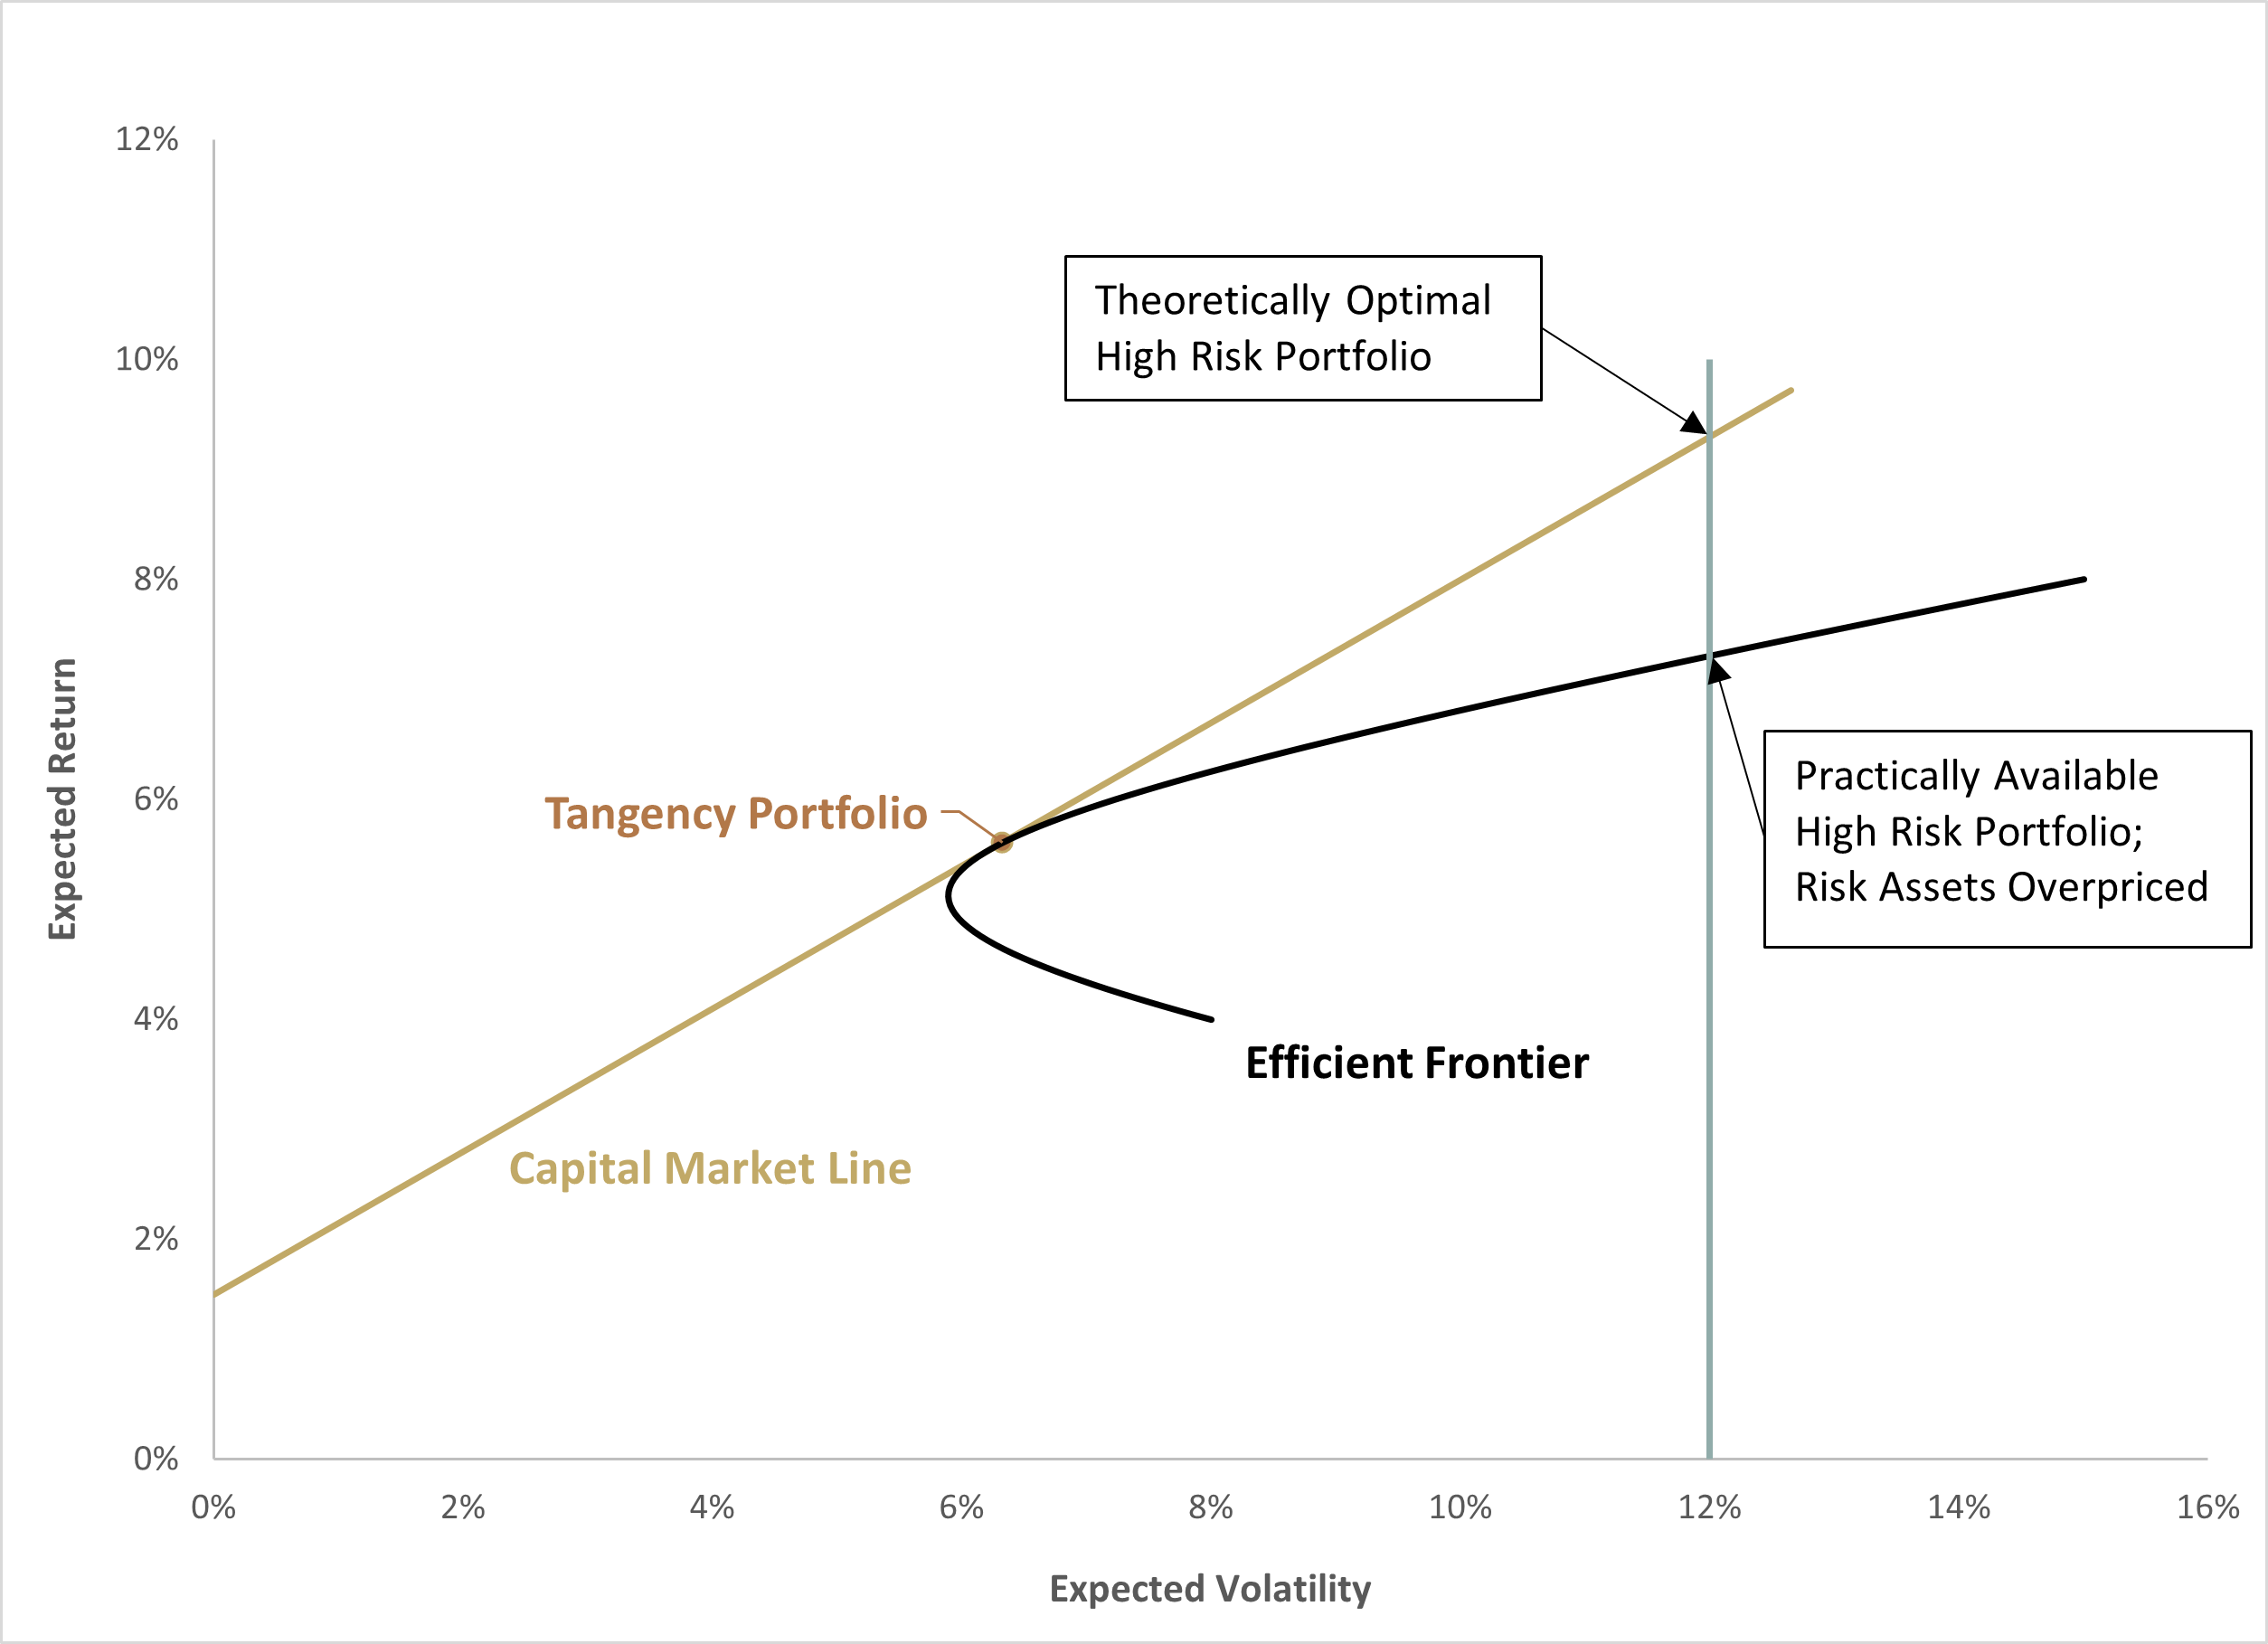
A foundational premise of the Capital Asset Pricing Model (CAPM) is that all investor portfolios should hold the tangency portfolio levered up or levered down to suit their risk preferences (see Figure 1), where the tangency portfolio is the efficient frontier portfolio that is tangent to a line drawn from the risk-free rate i.e. the “security market line”. For investors who want less risk than the tangency portfolio, their optimal portfolio is the one that is the mix of the risk-free asset and the tangency portfolio that meets their risk tolerance. For investors that want to take more risk than afforded by the tangency portfolio, their optimal portfolio is one that includes a levered position in the tangency portfolio, where their cost of obtaining that leverage is the risk-free rate.
This is not what happens in practice however, as leverage is not readily available at the risk-free rate or investors are simply not willing/allowed to deploy leverage. Given these extra costs or constraints, investors are forced to increase portfolio volatility by bidding up higher risk assets (those that are to the right of the tangency portfolio), making higher risk assets overvalued while simultaneously undervaluing lower risk assets. Figure 1 helps visualize this phenomenon. This then leads to the natural result that higher volatility assets should have artificially sedated risk premia while lower risk assets have artificially higher risk premia, creating an opportunity for a long/short factor betting against high volatility assets (relative to low volatility assets) to have a positive drift.
Empirical Results
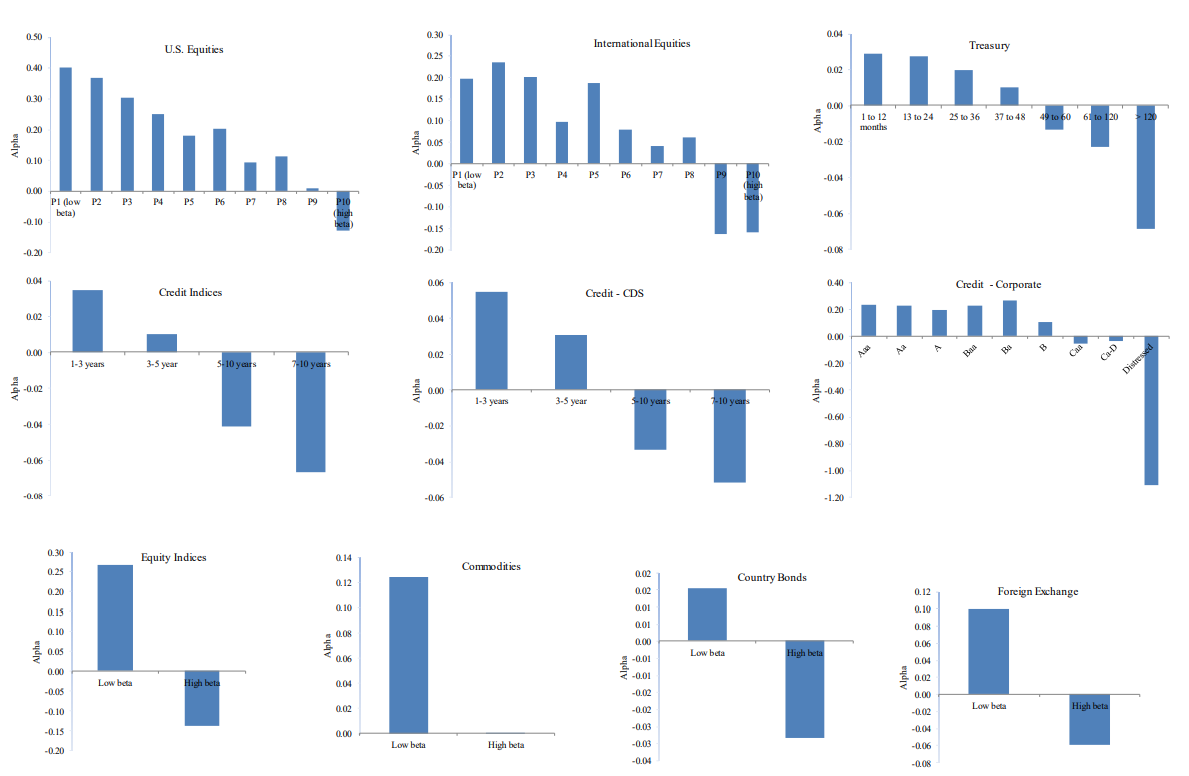
We expect the asymmetric over-allocation to higher risk assets due to limited use of leverage to compress returns of higher risk assets and elevate returns of lower risk assets. And it turns out we indeed see evidence of this result across a broad array of risky assets including global equity markets, credit markets, rates markets, currency markets, commodities, and sovereign debt. Figure 2 shows the results in cross section across this broad array of asset classes. While we do not explicitly see quality or junk sorted in Figure 2, we note that Q and J are a hybrid of both equity beta sorting and credit quality sorting, hence we expect to see this cross-sectional long/short opportunity in Q-J, precisely as exhibited in our last blog Efficient Credit Hedging With the Quality-Junk Factor.
A Simple Cycle Model for Q-J Dynamics
Armed with the knowledge that investors don’t generally lever up the tangency portfolio, we have a straightforward insight into the dynamics of the Q-J factor. Specifically, we can now understand how the factor evolves from being a positive carry engine, as reviewed above, to a credit hedge, as outlined in our previous blog.
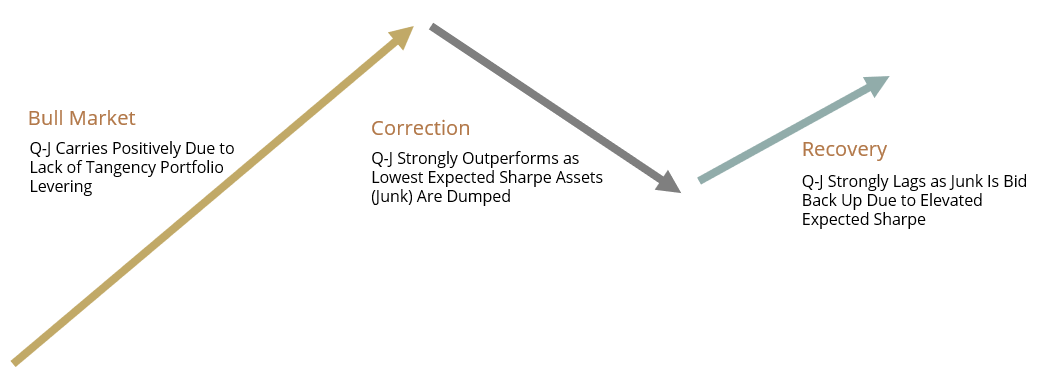
Figure 3 shows a stylized equity market cycle, with three core stages: bull market, correction, and recovery. During the bull market we see the core behavior of positive Q-J drift as investors face binding constraints on leverage and inefficiently bid up junk assets, keeping their risk premium muted relative to quality. As a correction begins, typically after an extended period of investors reaching for more and more risk to meet their expected return targets, investors dump the least efficient assets they hold. By definition, these are the high volatility junk assets with bid-up prices and a poor expected risk-adjusted return. As this sell off occurs, Q-J becomes a powerful hedge as its returns become positive while the aggregate market draws down. Finally, once enough junk has been sold to force its expected Sharpe ratio to be near the Security Market Line in Figure 1, higher risk tolerance investors pile back into junk due to its ability to effectively give someone the market line investment from levering the tangency portfolio, but without leverage.
Parting Words
We have shown that Q-J should be expected to have a positive drift due to the mechanics surrounding real-world leverage. In particular, without wide investment in levered versions of the tangency portfolio, lower beta assets will be undervalued during bull markets relative to higher beta assets, creating a positive expected return of a market-neutral long/short factor. And this phenomenon crosses all asset classes, including equity and credit, which is precisely why an equity construction of Q-J that simultaneously plays the phenomenon in equity and credit space, would strongly demonstrate this result. We have also shown how this theoretical framework around real-world leverage constraints succinctly explains Q-J dynamics over a market cycle.


