The shape of the US Treasury curve over the past five decades has provided investors with the opportunity to create more efficient long duration exposure than simply buying long-dated Treasuries. In this article we will show how the most efficient long duration exposure is often generated by levering a point in the middle of the Treasury curve. This technique maximizes the attractive coupons, roll yields, and relative financing rates in the belly of the curve, while simultaneously reducing volatility and other curve risks.
The Two Drivers of Carry in Treasuries
In this article we are interested in artificially creating a long duration Treasury exposure, specifically the 30-year Treasury, by levering a shorter part of the curve. Since we will precisely replicate the duration of our long bond target, the primary benefit of levering shorter-dated Treasuries is the creation of excess “carry”. Carry is simply the expected return of the bond when the yield curve is unchanged and is equal to the sum of “roll yield” and “coupon yield”. Let us now briefly review these two components.
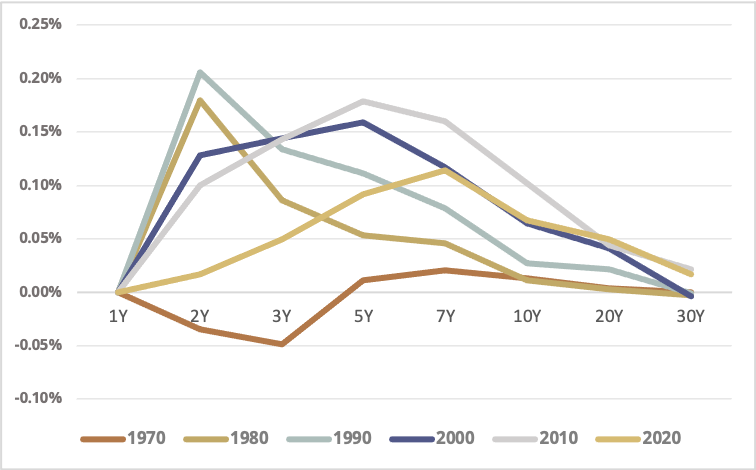
Roll yield is the annualized return earned on a bond by virtue of a bond’s yield moving up or down the curve via the passage of time (i.e. no curve changes and coupon payments are ignored). Roll yield is most attractive at the steepest part of the yield curve. Figure 1 shows the average annual roll yield (per unit of duration) across the Treasury curve, decade by decade. Duration-normalized roll yield is generally most attractive in the 2-to-7-year part of the curve. Levering Treasuries on this part of the curve to create longer duration assets maximizes roll yield harvesting.
Figure 1 – Average Annual Roll Yield Per Unit of Duration, US Treasuries, By DecadeSource: Bloomberg, Simplify Calculations. Note that the 1970s data begins February of 1977 and 2020s data ends July of 2021.
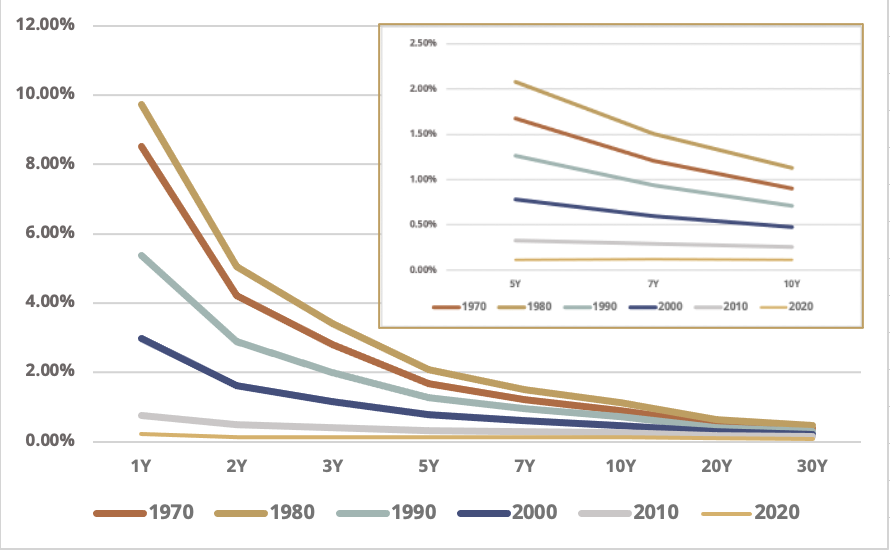
Coupon yield is the annualized return earned on a bond from its preset coupon payments (i.e. no curve changes and roll yield is ignored). Figure 2 shows the average annual coupon yield (per unit of duration) across the Treasury curve, decade by decade. Here, the potential benefit from levering the shorter end of the curve to synthetically create long duration is even more dramatic, as coupon yields collapse on a duration-adjusted basis as we go further out the yield curve.
Figure 2 – Average Annual Coupon Yield Per Unit of Duration, US Treasuries, By Decade (inset zooms in on the 5-to-10-year segment for clarity)Source: Bloomberg, Simplify Calculations. Note that the 1970s data begins February of 1977 and 2020s data ends July of 2021.
With roll yields and coupon yields (per unit of duration) highest toward the front end of the curve, we have demonstrated the potential benefits of gaining long duration exposure by levering up a short-to-intermediate-tenor Treasury. But there is a cost of implementing leverage, the financing rate, so let’s account for that now.
Levering to 30 Year Treasury Duration
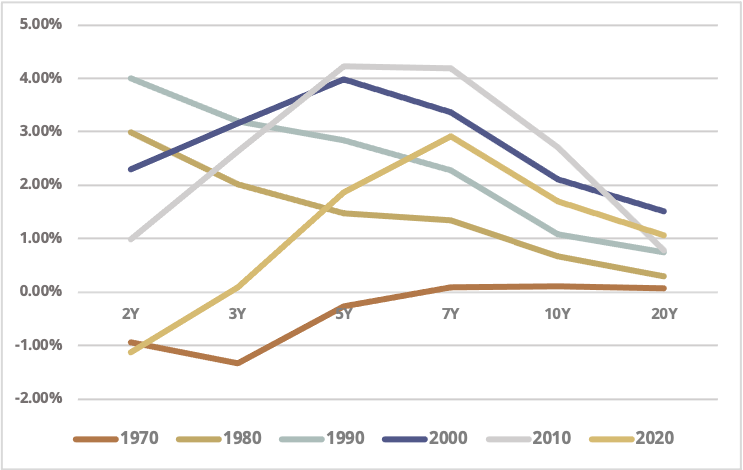
Let’s assume we can borrow at the 1-year Treasury rate, and let’s borrow enough so that we lever each tenor on the Treasury curve to the point where the duration matches that of the 30-year Treasury. Figure 3 shows the excess carry for this strategy (relative to the carry of the 30-year Treasury) for each tenor. After accounting for the financing cost of leverage, there has historically been the potential to add up to 4% of carry annually relative to a 100% cash position in the 30-year Treasury. Looking specifically at more recent history, represented by the 2010s and 2020s on the chart, excess carry has been maximized at the 5 to 7 year part of the curve.
Figure 3 – Excess Carry of Levered Strategies (Relative to 30-Year Treasury), By DecadeSource: Bloomberg, Simplify Calculations. Note that the 1970s data begins February of 1977 and 2020s data ends July of 2021.
As shown in Figure 3, over the past forty-five years, both the short and intermediate parts of the curve have provided some compelling opportunities to optimize carry. However, the short end of the curve presents some unique risks we generally want to avoid when targeting the 30-year Treasury’s duration. First, there is higher risk of negative excess carry at the short end via inversion of the curve, which we saw consistently in the 1970s. Second, levering the short end versus the middle of the curve requires considerably more leverage, an added challenge to executing this strategy. Third, implementation at the short end of the curve presents higher butterfly and twist basis risks than the middle of the curve (since further away from the long end of the curve). And fourth, the shorter end of the curve is generally more volatile on a duration-adjusted basis, thereby weakening the benefits of a short tenor strategy on a risk-adjusted basis.
Parting Words
The shape of the Treasury curve often provides investors with opportunities to create more efficient long duration exposure than simply buying long-dated Treasuries. By levering up at the middle of the curve, one can often benefit from attractive coupons, roll yields, and financing rates, while simultaneously minimizing volatility and other curve risks.