The latest inversion of the Treasury yield curve has been a popular topic of conversation among market pundits and participants alike. In this blog, we explain what a curve inversion is, why it is important, and what (if any) bearing it has on bond prices going forward.
The 2s10s Yield Curve
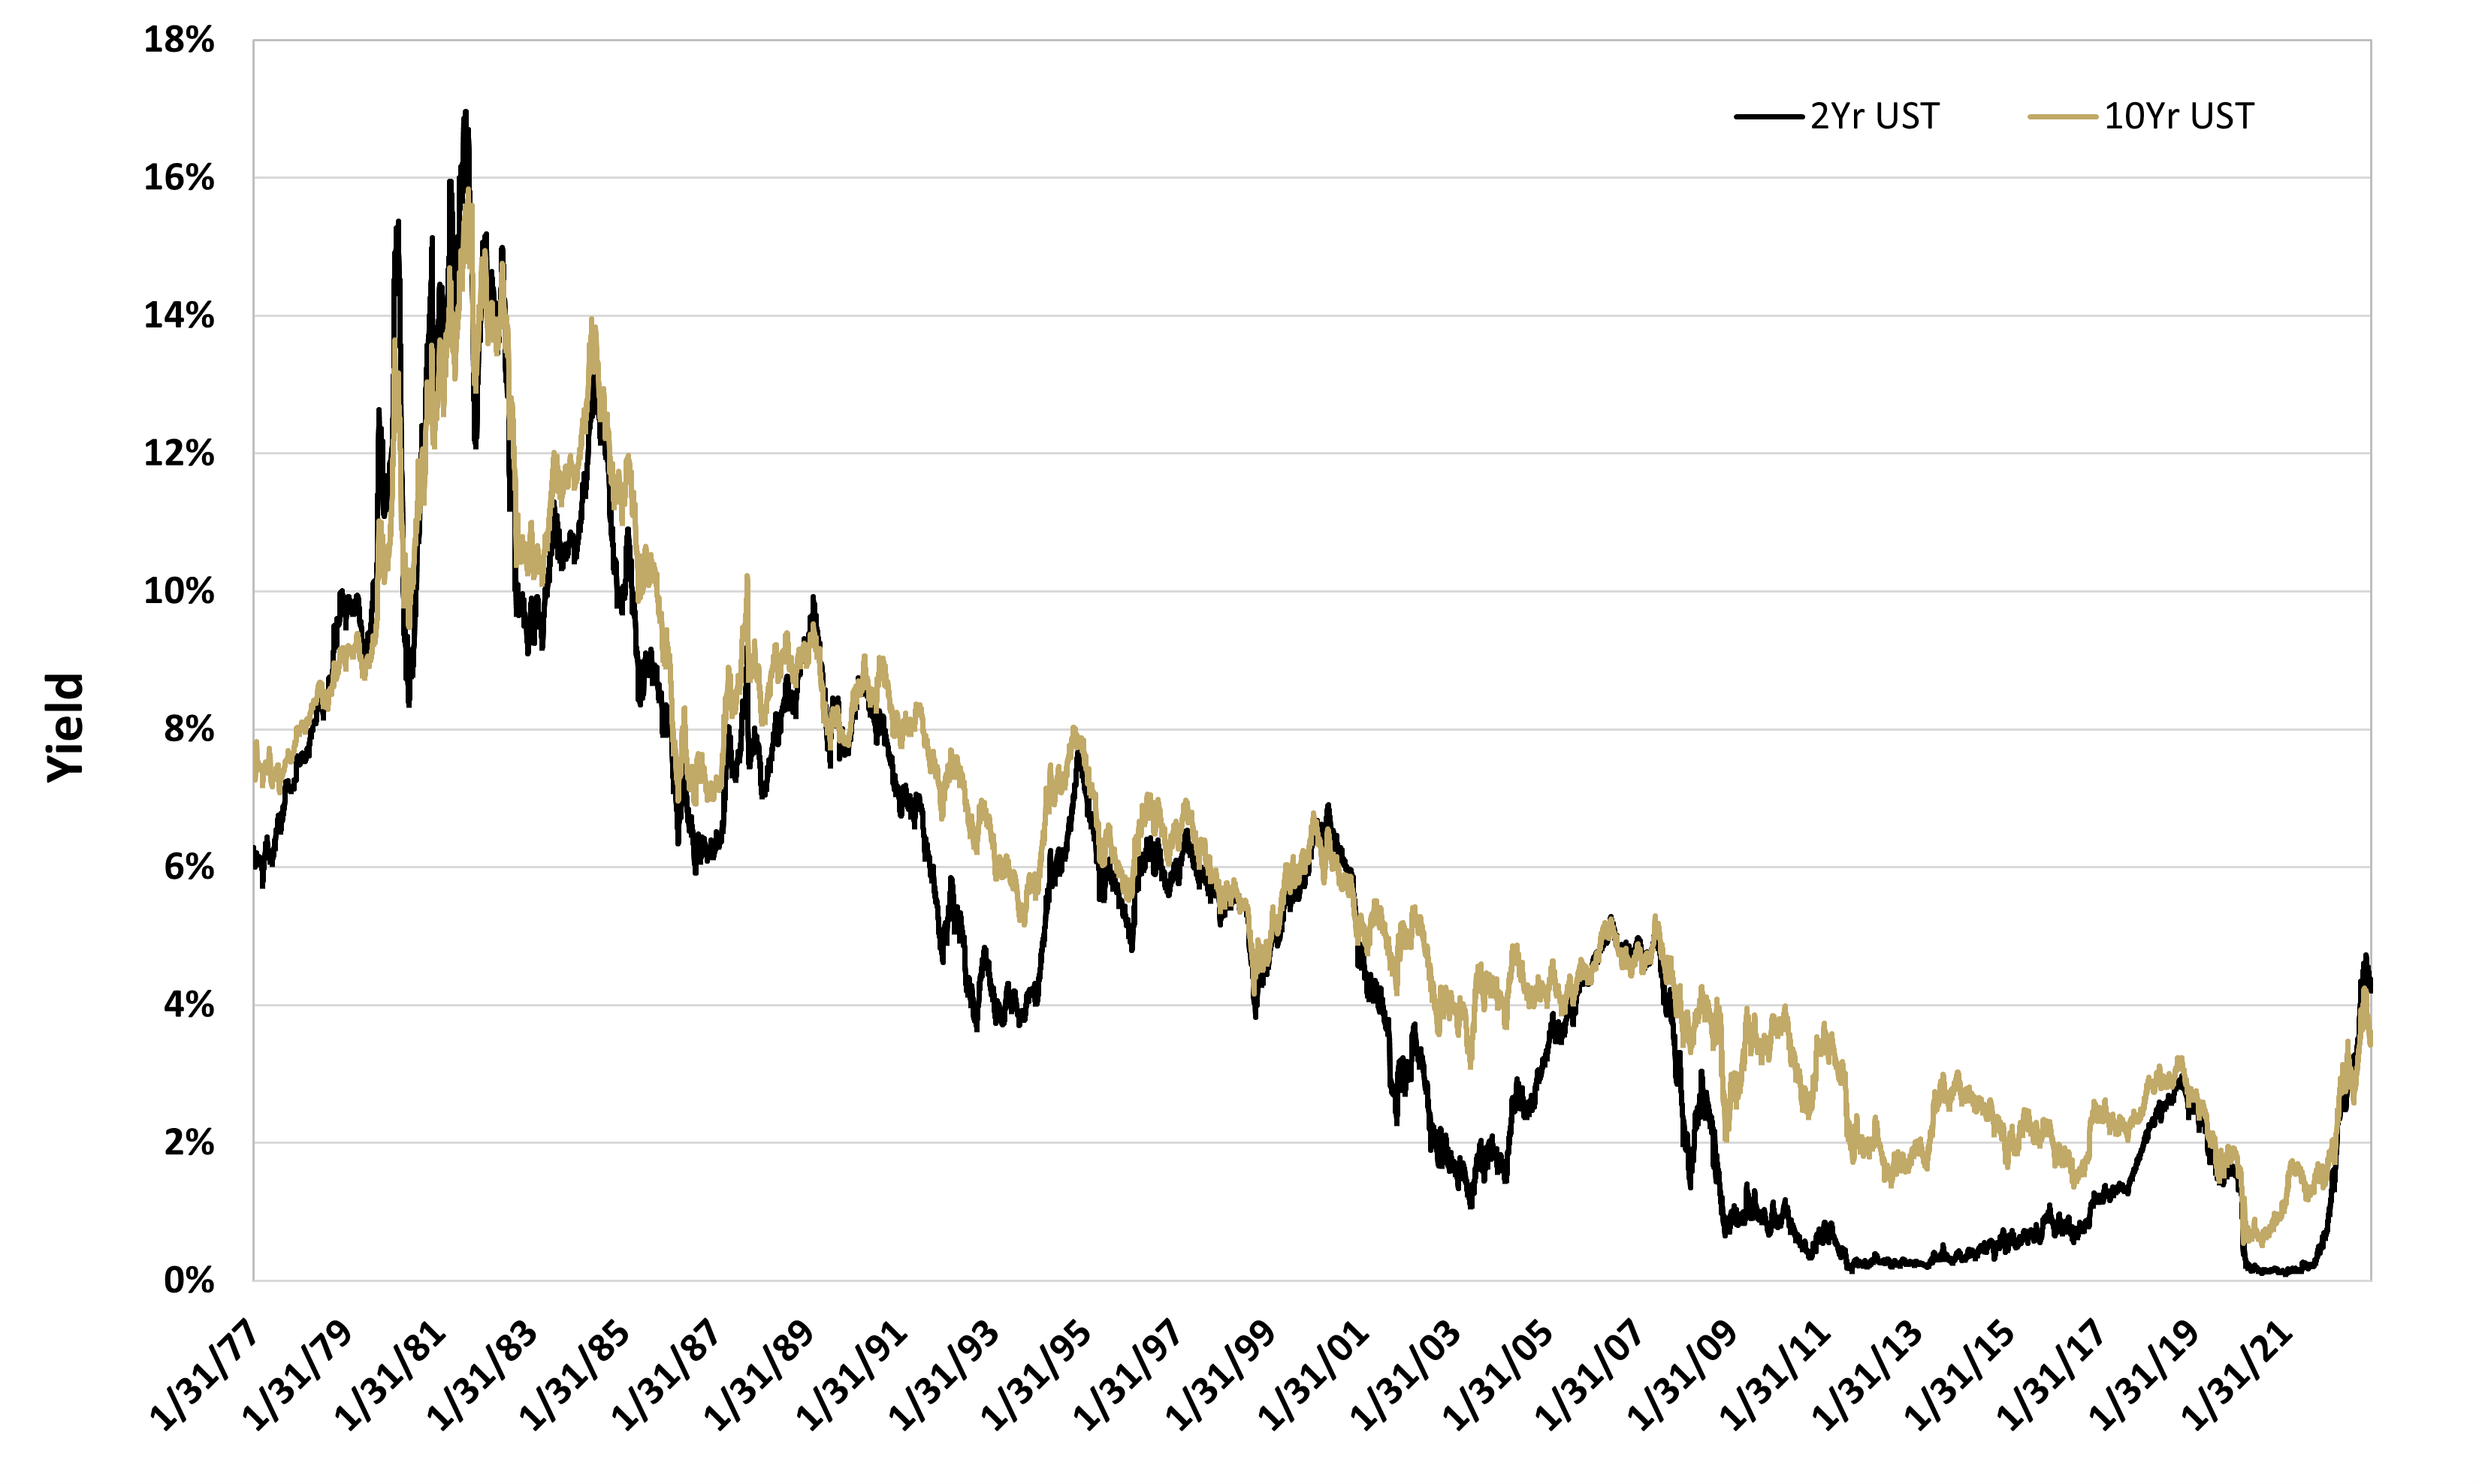
The 2s10s yield curve is a measure of the difference in interest rates between the two-year and ten-year Treasury bonds, which, as Figure 1 shows, generally tend to trend together with 10s yielding a premium to 2s. However, on rare occasions, the front end of the curve can become inverted as a result of Federal Reserve (Fed) policy intervention via raising short-term rates. Historically, an inverted yield curve has been a reliable predictor of an impending economic recession.
Figure 1: Government Bond Yields
12/31/1976 – 12/12/2022
Sources: Simplify Asset Management; Bloomberg.
Do Yield Curve Inversions Provide an Opportunity for Bond Investors?
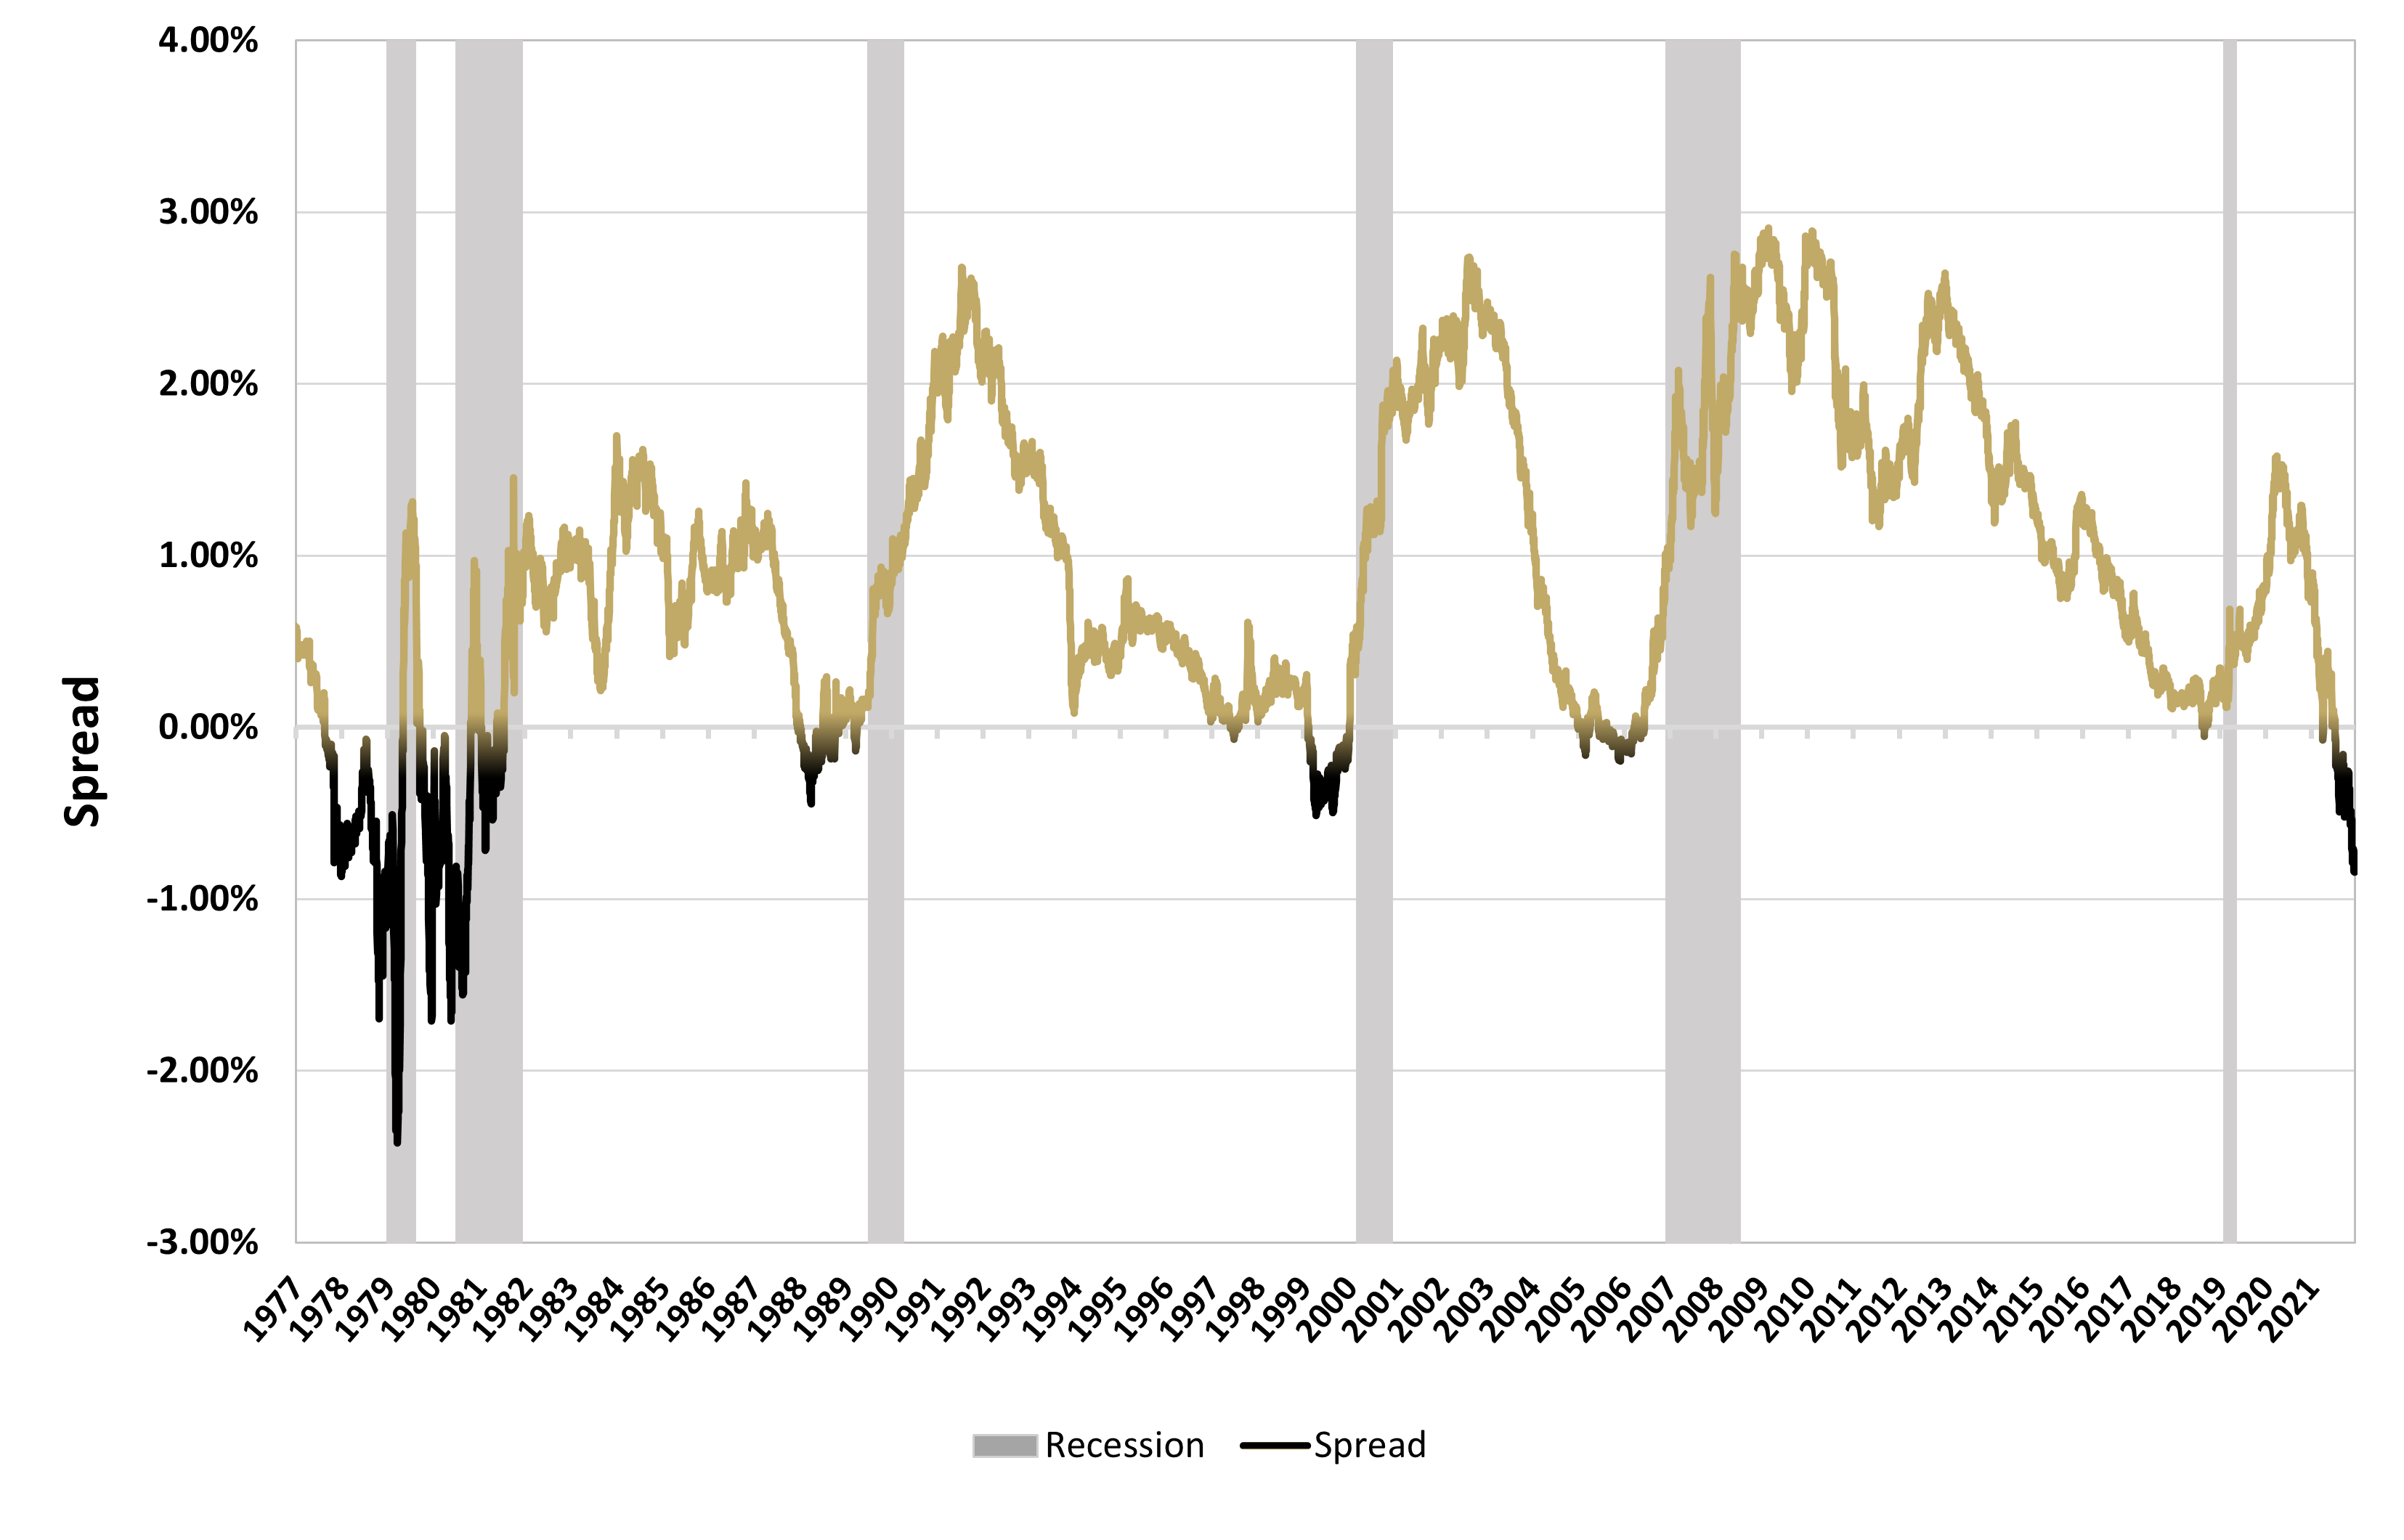
The 2s10s yield curve has inverted several times in the past, including before the recessions of the early 1980s, early 1990s, early 2000s, before the Great Financial Crisis, and briefly in 2019 preceding the COVID crisis. As shown in Figure 2 below, the yield curve inverted several months before the onset of the recession, providing a useful (and sometimes underappreciated) warning for investors and policymakers.
Figure 2: Spread Between 2yr & 10yr US Treasury Yields
12/31/1976 – 12/12/2022Sources: Simplify Asset Management; Bloomberg.
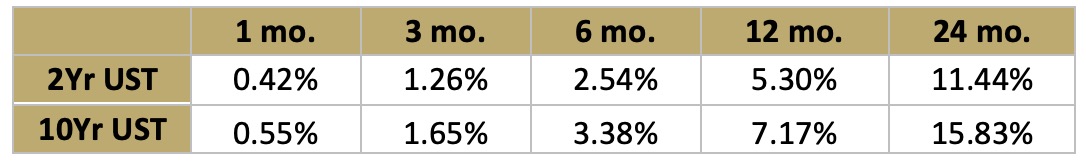
With the 2s10s curve having inverted once again in April of 2022, what might we expect for bonds going forward? First, we’ll assess the average rolling returns for on-the-run 2 and 10 year US Treasuries in Figure 3 below.
Figure 3: Average Rolling Returns for On-the-Run US Treasuries
12/31/1976 – 11/11/2022Sources: Simplify Asset Management; Bloomberg; Goldman Sachs. 12 and 24 month rolling total return calculations end on 12/10/2021 and 12/12/2019, respectively.
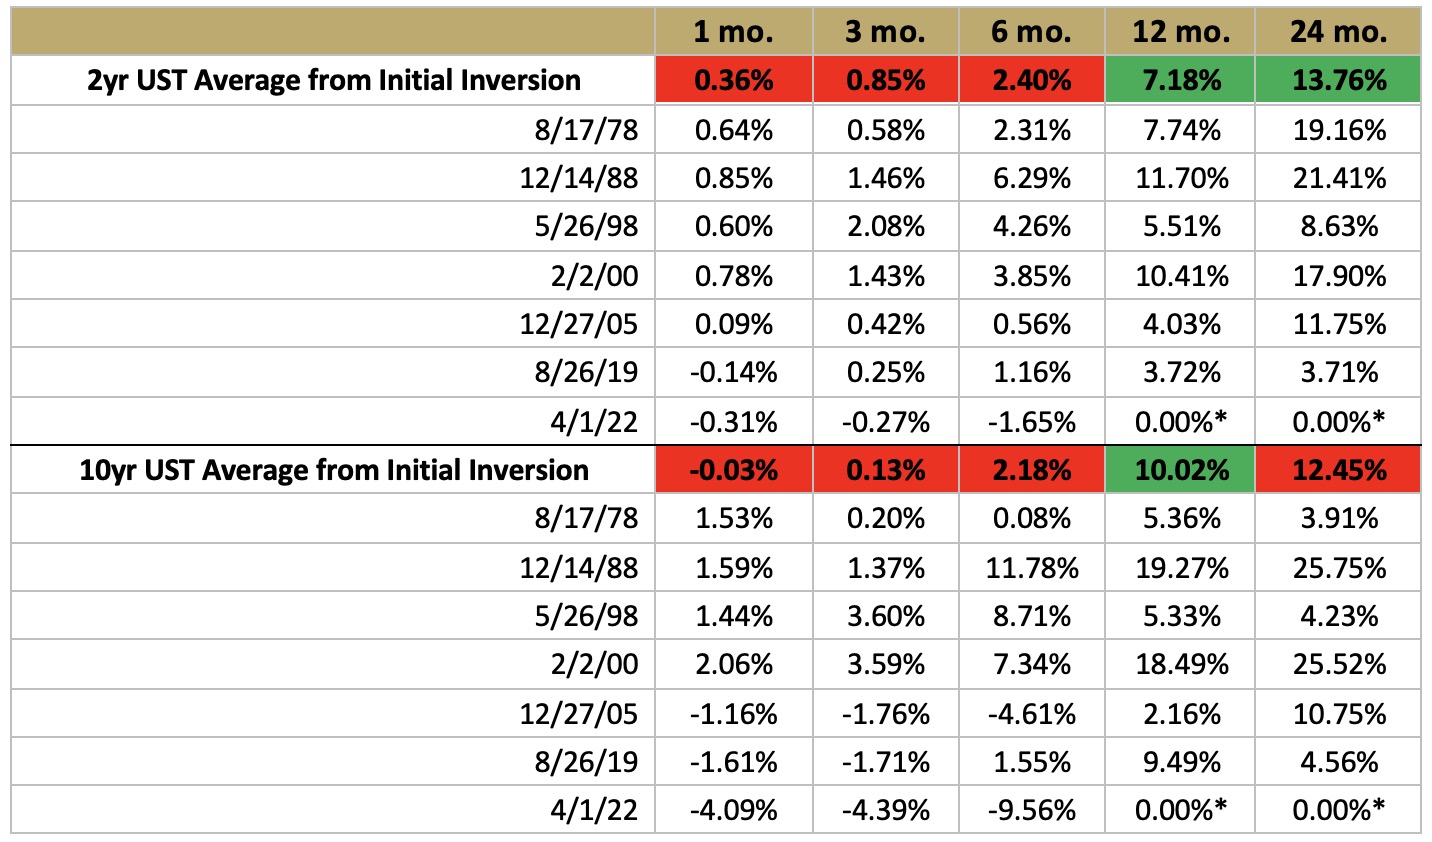
Next, we measure the average forward returns from the first day of a major yield curve inversion period to see if there was any advantage in purchasing bonds on these dates relative to any random starting point in the full sample. Figure 4 shows the results from the seven dominant inversion periods shown in Figure 2. Initial near-dated forward rolling returns were, on average, lower than the average forward returns during any market environment (highlighted in red).
However, longer-dated holding periods following an inversion typically offered, on average, forward returns that outperformed the average forward returns for the full observation period (highlighted in green). It is worth acknowledging that preconditions for each inversion were vastly different and as such, so we have posted the respective returns for each event in Figure 4 to help elucidate the variability within the average across macro environments.
Figure 4: Rolling Returns for On-the-Run US Treasuries After Initial Curve Inversions
12/31/1976 – 12/12/2022Sources: Simplify Asset Management; Bloomberg; Goldman Sachs. 12 and 24 month rolling total return calculations end on 12/10/2021 and 12/12/2019, respectively. Full inversion date ranges available upon request.
Patience for the Peak
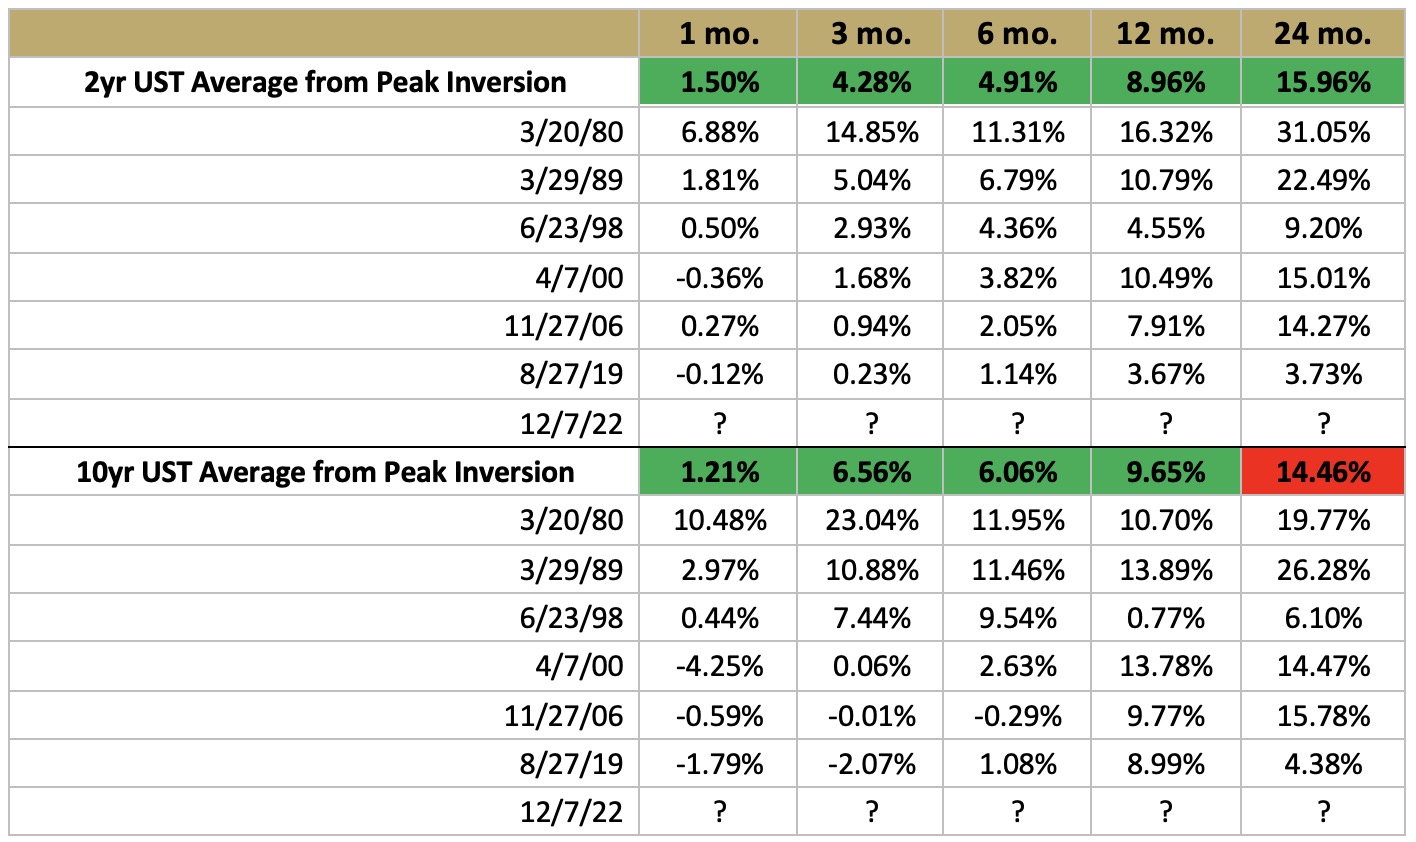
What if you had entered the trade at the widest point of the inversion rather than the beginning? Figure 5 shows just how strong those forward returns were. In all forward return assessments except for one, an investment in either the 2 year or 10 year Treasury resulted in above-average returns. Again, we present the full scope of data for context across time periods.
Figure 5: Rolling Returns for On-the-Run US Treasuries from Peak Curve Invertedness
12/31/1976 – 12/12/2022Sources: Simplify Asset Management; Bloomberg; Goldman Sachs. 12 and 24 month rolling return calculations end on 12/10/2021 and 12/12/2019, respectively. Full inversion date ranges available upon request.
Most recently, the 2s10s yield curve inverted on April 1st of 2022 and widened to a spread of 84 basis points in early December before narrowing modestly by the time of this publication. The average time between the beginning of a curve inversion and its maximum width since 1977 is approximately seven and a half months. We are now eight months inverted and counting.
Parting Words
We have discussed why the yield curve inversion is important to investors while showing that such an event, despite not offering an immediate boon for bond investors, does support both intermediate and long-term forward return outperformance. Further, we have also demonstrated that bond price returns following the peak of a yield curve inversion tend to produce above average forward-looking returns across most time horizons.