As 2021 progressed, observers of the economy understandably wrestled with the nature of increasing inflation and the term “transitory.”
While that term transitory was initially spoken with deep, sonorous gravitas, it was poorly defined and poorly received, and ultimately most observers abandoned the term if not the belief that inflation was short-lived and limited to sectors hit hardest by the pandemic.
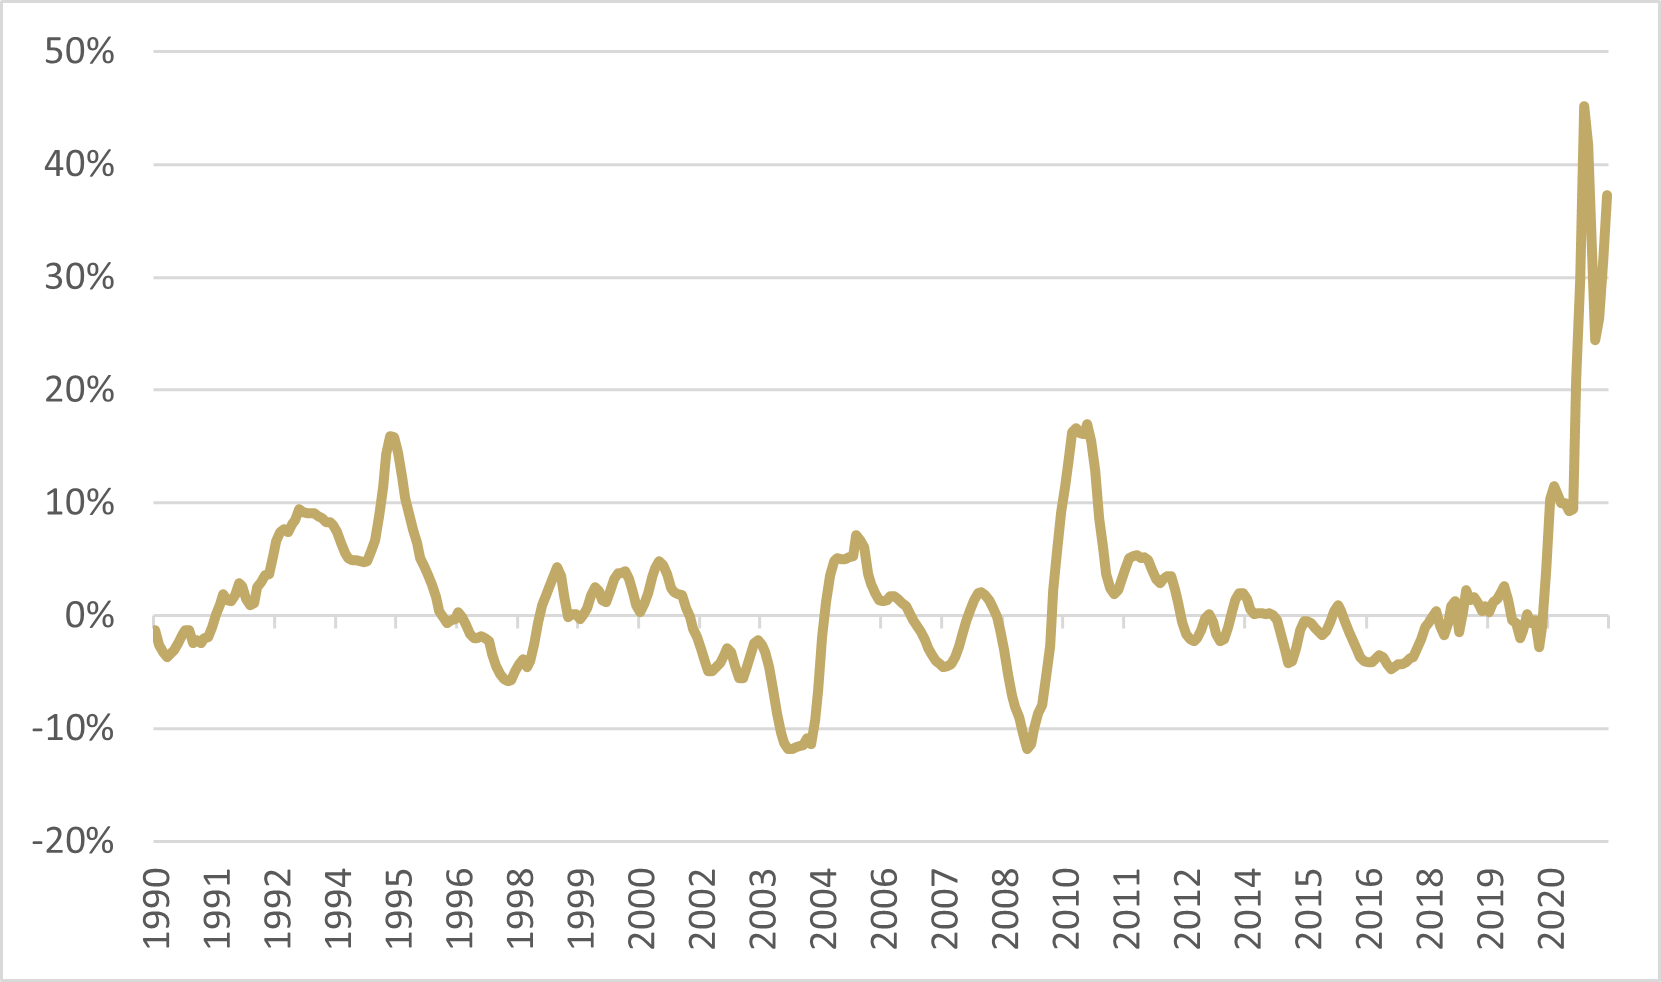
Some of the debate about the meaning of the word “transitory” was sophistical. Because inflation is expressed as a rate of change, by definition all inflation is transitory; in this sense, the statement that inflation of any particular product or service is “transitory” is trivial. For example, in June 2021 the 12-month inflation in the Consumer Price Index (CPI) for Used Cars and Trucks reached 45% (see Figure 1). It was no courageous forecast to call this change “transitory,” since inflation of 45% over 5 years would mean the used car you buy for $10,000 today would cost $64,100 in 2027.
Figure 1 – Y/Y Change in CPI for Used Cars and TrucksSource: Bloomberg
This change in used car prices, along with other “COVID Categories” such as Lodging Away from Home, Airfares, etc. are collectively a small part of the overall consumption basket – but when they sport large price changes, these little categories can have a big impact on the reported inflation numbers. So, when economists and the Federal Reserve described inflation as transitory, they meant the effects that could be attributed loosely to pandemic-related supply-chain issues would pass and the overall level of inflation would return to what it had been pre-pandemic.
This expectation of a “return to normal” is the same reason we often look at “core” inflation by taking out food and energy categories, which can have large swings over short periods but then return to previous levels. In essence, by filtering out the noise, an observer can make a better prediction based on the underlying signal.
To be clear, there is no debate about the severity of the price moves in certain categories. The question, though, is attribution. How much inflation is tied to the spike in Used Car prices and other “COVID Categories,” and how much is tied to more-worrisome pressures.
In mid-2021, many observers felt it likely that the inflation spike was mostly noise that would soon pass, since the advance in the numbers was fairly narrow. Broader metrics, like the Cleveland Fed’s Median or Trimmed Mean CPI, were not showing the upward pressure of headline or core. In April, while headline CPI was 4.2% y/y and core CPI was 3.0%, Median CPI was only 2.1% and Trimmed Mean was 2.4%.
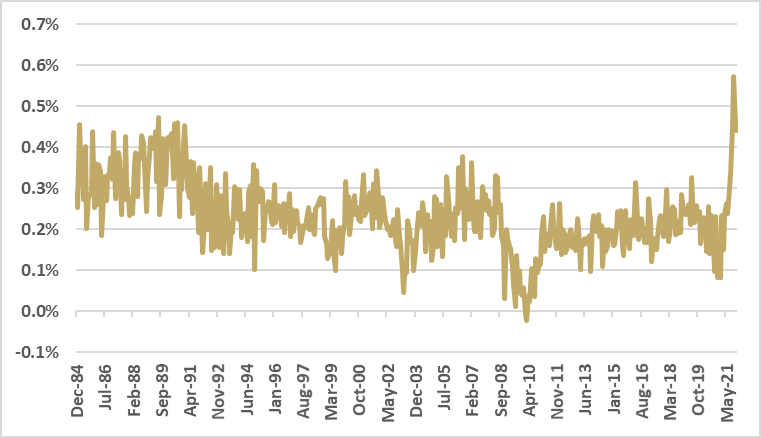
As the summer went on, however, both the main figures and the broader numbers started to increase dramatically. The latter was more disturbing. In October, the Cleveland Fed’s CPI jumped 0.57% month/month – the largest single jump in that indicator, by a lot, since 1982 (see Figure 2).
Figure 2– M/M Change in Cleveland Fed's Median CPISource: Bloomberg
The broadening of the upward inflation impulse, even if parts of it are temporary, are broadenough to suggest that the old normal is not the current normal. It is likely that the new equilibrium for inflation is at least 0.5%-1.0% higher than the old equilibrium, and that the volatility of inflation will not be short-lived.
We were not surprised by the broadening of inflation, and we believe it will persist for a while at least. For the last 22 months we have witnessed a parade of extraordinary and unprecedented policies from legislatures and central banks around the world, especially in the United States. And these policies had very direct effects that presaged the unfortunate indirect impact on inflation.
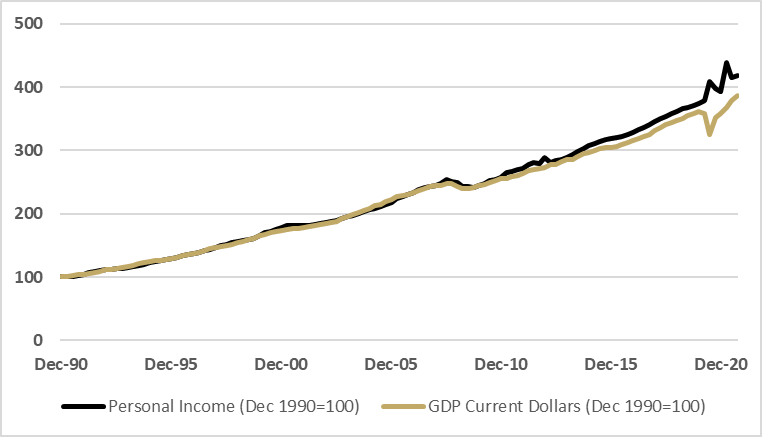
Figure 3 illustrates that normal recoveries from recession – of which there are three on the chart (early 90s, Tech Bubble, GFC) – involve income and output expanding at approximately the same pace. It’s essentially interconnected. Personal income (primarily employee and business owner compensation) is derived from production, and production is purchased with said compensation.
Figure 3 – Income and Output Through Multiple RecessionsSource: Bloomberg
Unless, that is, the government starts manufacturing personal income without taking it from someone else through taxes or by selling debt. It is able to do that because the Federal Reserve has been buying that debt with reserves that it has the power to create. That result is shown in the divergence of the two lines in the chart above associated with the latest recovery. It is a dramatic departure from the way that recessions and recoveries have been managed and nurtured before.
The gap between the gold line and the black line represents liquidity that has been added permanently to the system (unless, that is, the Fed now leans in the other direction and pulls personal income below output, which seems improbable as it would cause a severe recession and avoiding a severe recession was the whole point of the policy in the first place).
If the money is here to stay, then the process has changed in ways that are at least semi-permanent. The inflationary consequence is inevitable and while we don’t believe it’s permanent, we don’t believe it will be short-lived either. We should continue to have above normal inflation for 2022 and 2023, and as for after that, tell us what the Fed will do and we can help answer that question.