
Share
Introduction
Investors have in recent years sought to broaden their portfolios away from the traditional 60/40 allocation between stocks and bonds. This often entails shifting to something like a 50/30/20 portfolio, the last component of which serves as an “alternatives bucket.” There is no shortage of options with which to fill this bucket. But the “alternative” label often obscures the fact that many of these products do little to smooth the return profile of the resulting portfolio compared to the 60/40 starting point. Moreover, since the alternative bucket is usually relatively small, investors often miss the opportunity to stir it up with simultaneous allocations to multiple strategies.
Simplify launched the Simplify Managed Futures Strategy ETF (CTA) in 2022. In addition to aiming for returns that are competitive with both stocks and bonds, CTA seeks to pass the litmus test of an alternative: a performance pattern that differs from equities and fixed income. Notwithstanding our confidence that CTA will continue to exhibit both these characteristics, similar to how diversification benefits stock and bond portfolios, we see value in diversifying within the alternatives bucket. In particular, the Simplify Currency Strategy ETF (FOXY), Simplify Target 15 Distribution ETF (XV), and Simplify Commodities Strategy No K-1 ETF (HARD) are ideally positioned to fill this role, or rather, to top off the bucket.
Alternative…to What?
There is a long list of assets that investment managers would like to convince investors are alternatives. That list includes commodities, gold, timber, real estate, private equity, private credit, artwork, and crypto assets, to name a few. A cynic might simply say an alternative is anything but plain vanilla stocks or bonds. Another angle may be the degree to which an asset exploits a risk premium that is not widely available in public equities or debt.
However, a common-sense approach might be to reorient the definition away from what it is to how it behaves, particularly in relation to the performance of stocks and bonds. In other words, as noted above, an “alternative” is an asset whose performance is appreciably different, perhaps one could say lowly or negatively correlated, to stocks and bonds. Using this simple criterion could both narrow and expand what merits consideration in the alternatives bucket.
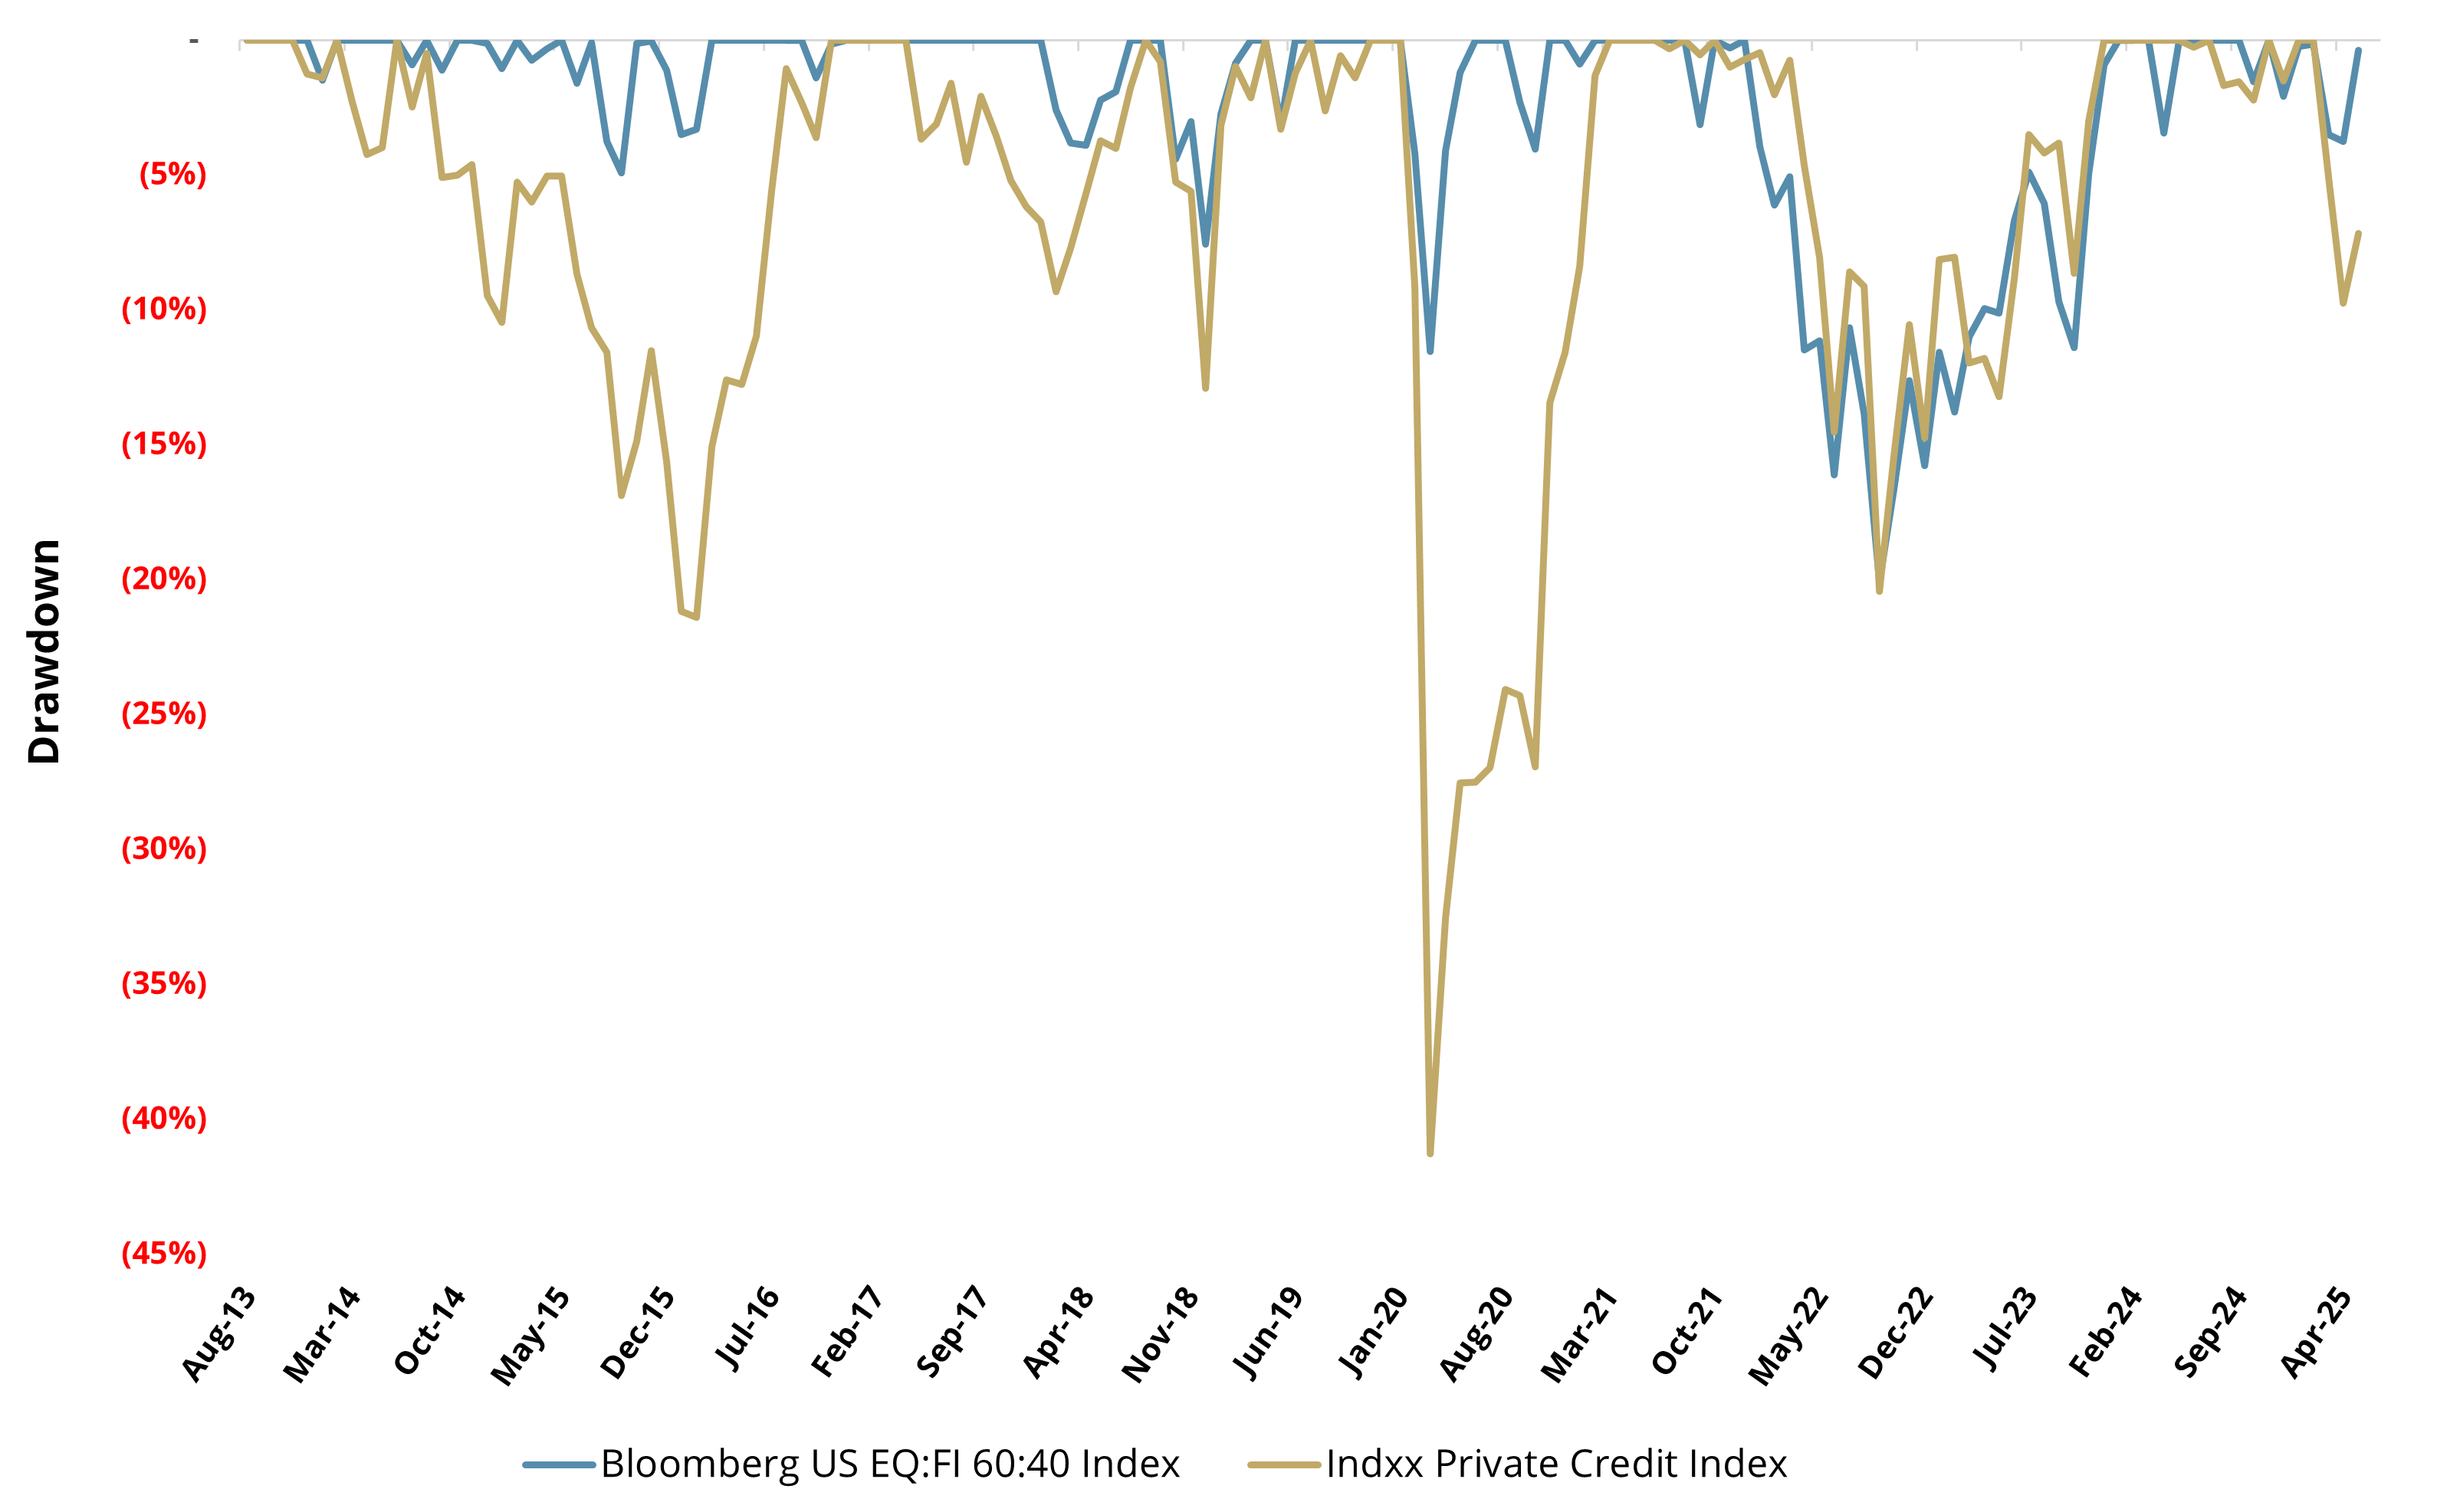
As an example, private credit has recently come into the spotlight as an alternative for individual investors. Figure 1 shows the drawdown history of the classic 60/40 alongside that of the Indxx Private Credit Index. Even absent any proper statistical analysis, it seems clear that private credit might not be the optimal solution for investors looking for something to zig when stocks and bonds zag. The aim here is not to suggest private credit is a bad investment. But for purposes of filling the alternatives bucket, it might not be worth the pour.
Figure 1: 60/40 vs. Indxx Private Credit Index Drawdowns
August 2013 – May 2025
Taking a more expansive view, Figure 2 shows the correlations between the S&P 500 Index, the 60/40 mix, and a handful of other indices. Among those commonly viewed as alternatives, there may be a few surprises. For example, with their high correlations to stocks and 60/40, neither Real Estate nor the two flavors of Private Equity (Buyout and Venture Capital) appear to provide a lot of diversification.
Figure 2: Return Correlations
May 2021 – May 2025
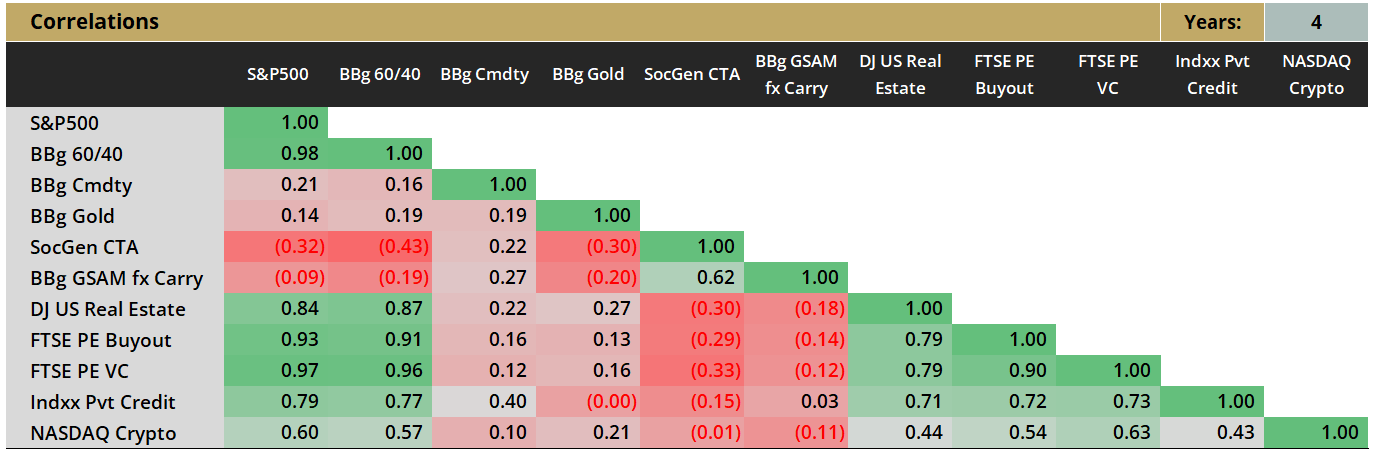
Less surprising: both broad commodity exposure and gold have solid diversification potential. And regular Simplify readers might have expected the negative correlation between 60/40 and the SocGen CTA Index, which is the benchmark for our own CTA.
Investors may also do well to consider things that might not immediately come to mind in a discussion about alternative investments. For example, the Bloomberg GSAM FX Carry Index—a benchmark comprised of currencies—is not only negatively correlated with stocks and 60/40, but its correlation with the SocGen CTA Index is fairly muted as well.
Of course, some things do not lend themselves to inclusion in the table above on account of lacking data, but investors would do well to consider them. Structured notes—already used by many in portfolio construction—can provide solid returns while exhibiting little in the way of co-movement with either core holdings or other alternatives.
One other thing to note: the representative index used in the private credit example above is comprised of actual manager results rather than the performance of an asset in a vacuum. If the bogey captures an average of funds, then logically, some managers are doing worse (perhaps by a lot) and some are doing better (also perhaps by a lot).
The same holds for many of the benchmarks used in the alternative space, which highlights another important consideration: manager selection matters a lot when it comes to alternatives. For example, we attribute the success of CTA directly to the philosophy, process, and people managing the fund. There are plenty of managed futures ETFs out there, but there is only one CTA.
Stirring the Bucket
Our client conversations suggest that many investors make an allocation to a single alternative. They thus forsake the benefits of diversifying over the many strategy types which could potentially fill their alternatives bucket. We believe that constructing a portfolio of alternatives—in the same way an investor might blend exposures over different markets and/or managers in the equity and bond portions of their portfolio—makes sense.
The four Simplify funds listed below collectively exemplify all of what we have discussed thus far. While their histories are in some cases short,1 our analysis suggests that their behavior provides attractive diversification not only with a 60/40 baseline, but relative to each other as well. This complementarity makes each an attractive candidate for inclusion in an investor’s alternatives allocation. And each is structured to provide attractive returns geared to risk premia which are often modestly represented, if at all, in traditional stock and bond investments.
- Simplify Managed Futures Strategy ETF (CTA): Simplify’s flagship managed futures offering with a -0.4 correlation to 60/40 since its inception in March 2022 and a track record of positive convexity in risk-off environments. CTA employs a systematic approach to going long and short various commodities with daily rebalancing and no equity or currency exposure.
- Simplify Currency Strategy ETF (FOXY): Our recently launched systematic currency strategy that aims to harvest yield from the foreign exchange market. Separate modeling for DM and EM currencies accounts for differences in market structure while effectively capturing the distinct yet persistent behaviors of both. Volatility scaling aims to maintain an attractive return profile while guarding against drawdowns.
- Simplify Commodities Strategy No K-1 ETF (HARD): Our long-biased commodities ETF that seeks to provide attractive returns alongside inflation hedging. Utilizes a risk-based allocation framework to reduce exposure when markets are showing signs of vulnerability.
- Simplify Target 15 Distribution ETF (XV): Simplify’s recently incepted approach to generating attractive monthly income through tightly risk-managed volatility selling. XV squarely targets an outcome rather than judging itself solely against the performance of a benchmark, providing income alongside anticipated modest correlations with other assets. We view XV as a compelling replacement for the structured notes investors may already be utilizing, but with numerous operational benefits in addition to its investment merit.
In Conclusion
Simplify advocates an allocation to alternatives as part of a well-diversified portfolio. The specific percentages will vary based on the circumstances of the investor. However, we believe it is important to exercise prudence on what to consider for inclusion in the alternatives bucket. Specifically, asset behavior—both realized and expected—is a more relevant consideration than simply whether something is labeled as an alternative. Moreover, diversification not just to alternatives but within them as well is an oft-overlooked opportunity.
We have highlighted four Simplify funds that we believe can empower investors to maximize the benefits of their allocation to alternatives. We look forward to connecting to discuss how we can help make them work for your portfolio.
1Inception dates: XV Apr 14’25, FOXY Feb 3’25, HARD Mar 27’23, CTA Mar 7’22
GLOSSARY
Bloomberg Commodity Index Total Return (BBg Cmdty): Composed of futures contracts and reflects the returns on a fully collateralized investment in the Bloomberg Commodity Index (BCOM.) BCOM is made up of 23 exchange-traded futures on physical commodities, representing 21 commodities which are weighted to account for economic significance and market liquidity. This combines the returns of the BCOM with the returns on cash collateral invested in 13 week (3 Month) U.S. Treasury Bills.
Bloomberg Gold Subindex Total Return (BBg Gold): Reflects the return on fully collateralized future positions.
Bloomberg GSAM FX Carry Index (BBg GSAM fx Carry): Provides an equal risk weighted exposure to the Bloomberg GSAM FX G10 and EM Carry strategies. These strategies rank the currencies using an average of recent implied US dollar interest rates as the carry measure.
Bloomberg US EQ:FI 60:40 Index (BBg 60/40): Designed to measure cross-asset market performance in the US. The index rebalances monthly to 60% equities and 40% fixed income. The equity and fixed income allocation is represented by Bloomberg US Large Cap (B500T) and Bloomberg US Agg (LBUSTRUU) respectively.
Contango: A situation where the futures price of an asset is higher than the spot price. This results in an upward-sloping forward curve.
Dow Jones US Real Estate Total Return Index (DJ US Real Estate): Represents REITs & other companies that invest directly or indirectly in real estate through development, management or ownership, including property agencies. The index is a subset of the Dow Jones U.S. Index, which covers 95% of U.S. securities based on float-adjusted market capitalization. Index was first calculated on February 14, 2000.
Foreign Exchange Market (FX): The global marketplace for the trading of one nation's currency for another.
FTSE Private Equity Buyout Index (FTSE PE Buyout): Measures the performance of the US private equity buyout industry through a combination of liquid and publicly traded assets. These publicly traded assets are allocated across seven sector portfolios, each representing a different sector in which US private equity buyout firms invest.
FTSE Private Equity Venture Capital Index (FTSE PE VC): Seeks to replicate the performance of the FTSE Venture Capital Benchmark Index through a combination of liquid, publicly listed assets. These publicly traded assets are allocated across seven sector indices, each representing a different sector in which US venture capitalists invest.
Indxx Private Credit Index (Indxx Pvt Credit): Tracks the performance of the Business Development Corporations (BDCs) and Closed-End Funds (CEFs), trading in the US, with significant exposure to private credit, as defined by Indxx.
Managed Futures: An investment where a portfolio of futures contracts is actively managed by professionals. Managed futures are considered an alternative investment and are often used by funds and institutional investors to provide both portfolio and market diversification.
Nasdaq Crypto Index (NASDAQ Crypto): Designed to measure the performance of a significant portion of the digital asset market and to provide a benchmark for institutional investment in this new and emerging asset class. The Index is specifically designed to be dynamic in nature, broadly representative of the market, and readily trackable by investors.
S&P 500 Total Return Index (S&P500): The S&P 500® is widely regarded as the best single gauge of large-cap U.S. equities and serves as the foundation for a wide range of investment products. The index includes 500 leading companies and captures approximately 80% coverage of available market capitalization. The S&P 500 Total Return Index is based on the price changes and reinvested dividends of the S&P 500.
SG CTA Index (SocGen CTA): Calculates the net daily rate of return for a group of 20 CTAs selected from the largest managers open to new investment. The SG CTA Index is equal-weighted and reconstituted annually and has become recognized as the key managed futures performance benchmark.
Structured Note: A debt obligation that also contains an embedded derivative component that adjusts the security's risk-return profile.
Volatility: A measure of how much and how quickly prices move over a given span of time.