Equity
Equity
Enhancing Portfolio Income with the Equity Volatility Premium
Share

Introduction
With more than 118 million Americans in or nearing retirement (age 50 or older)[1], income has become a key component for many portfolios. But as asset allocators reach for yield in a low-rate environment, they must be extra mindful of the additional risks they may be accepting.
In this blog we demonstrate that the equity volatility premium is a compelling strategic income holding given its attractive risk-adjusted income profile. We also show that the short volatility strategy allows for effective tactical positioning based on starting VIX levels and starting expected roll yields, a forecasting feature not typically available in other income strategies.
Maximizing Risk-Adjusted Income
Let’s begin by considering the classic risk-reward tradeoff for the most popular income-focused strategies[2]: US Treasuries, US High Yield Bonds, Mortgage REITs, MLPs, EM Sovereign Debt, and the Volatility Premium (we assume a 25% exposure to the standard front month VIX short due to its relatively optimal geometric growth characteristics, as previously discussed here). Figure 1 shows the historical yield[3] vs volatility (gold dots) for our full universe of income strategies, over the decade ending Sept. 15, 2021. The strategies generally follow the relationship between risk and return one would expect from the Capital Asset Pricing Model (CAPM), with one notably positive outlier: the equity volatility premium. From a CAPM perspective, the equity volatility premium is a dominant strategic position for income. This strategy is such a strong outlier that the r-squared for the linear fit between yield and volatility across the strategies is only 0.29, whereas without this point the r-squared increases to 0.70. Now volatility is not the only risk one can be compensated for, one could also be accepting increased left-tail risk, so let’s account for that now.
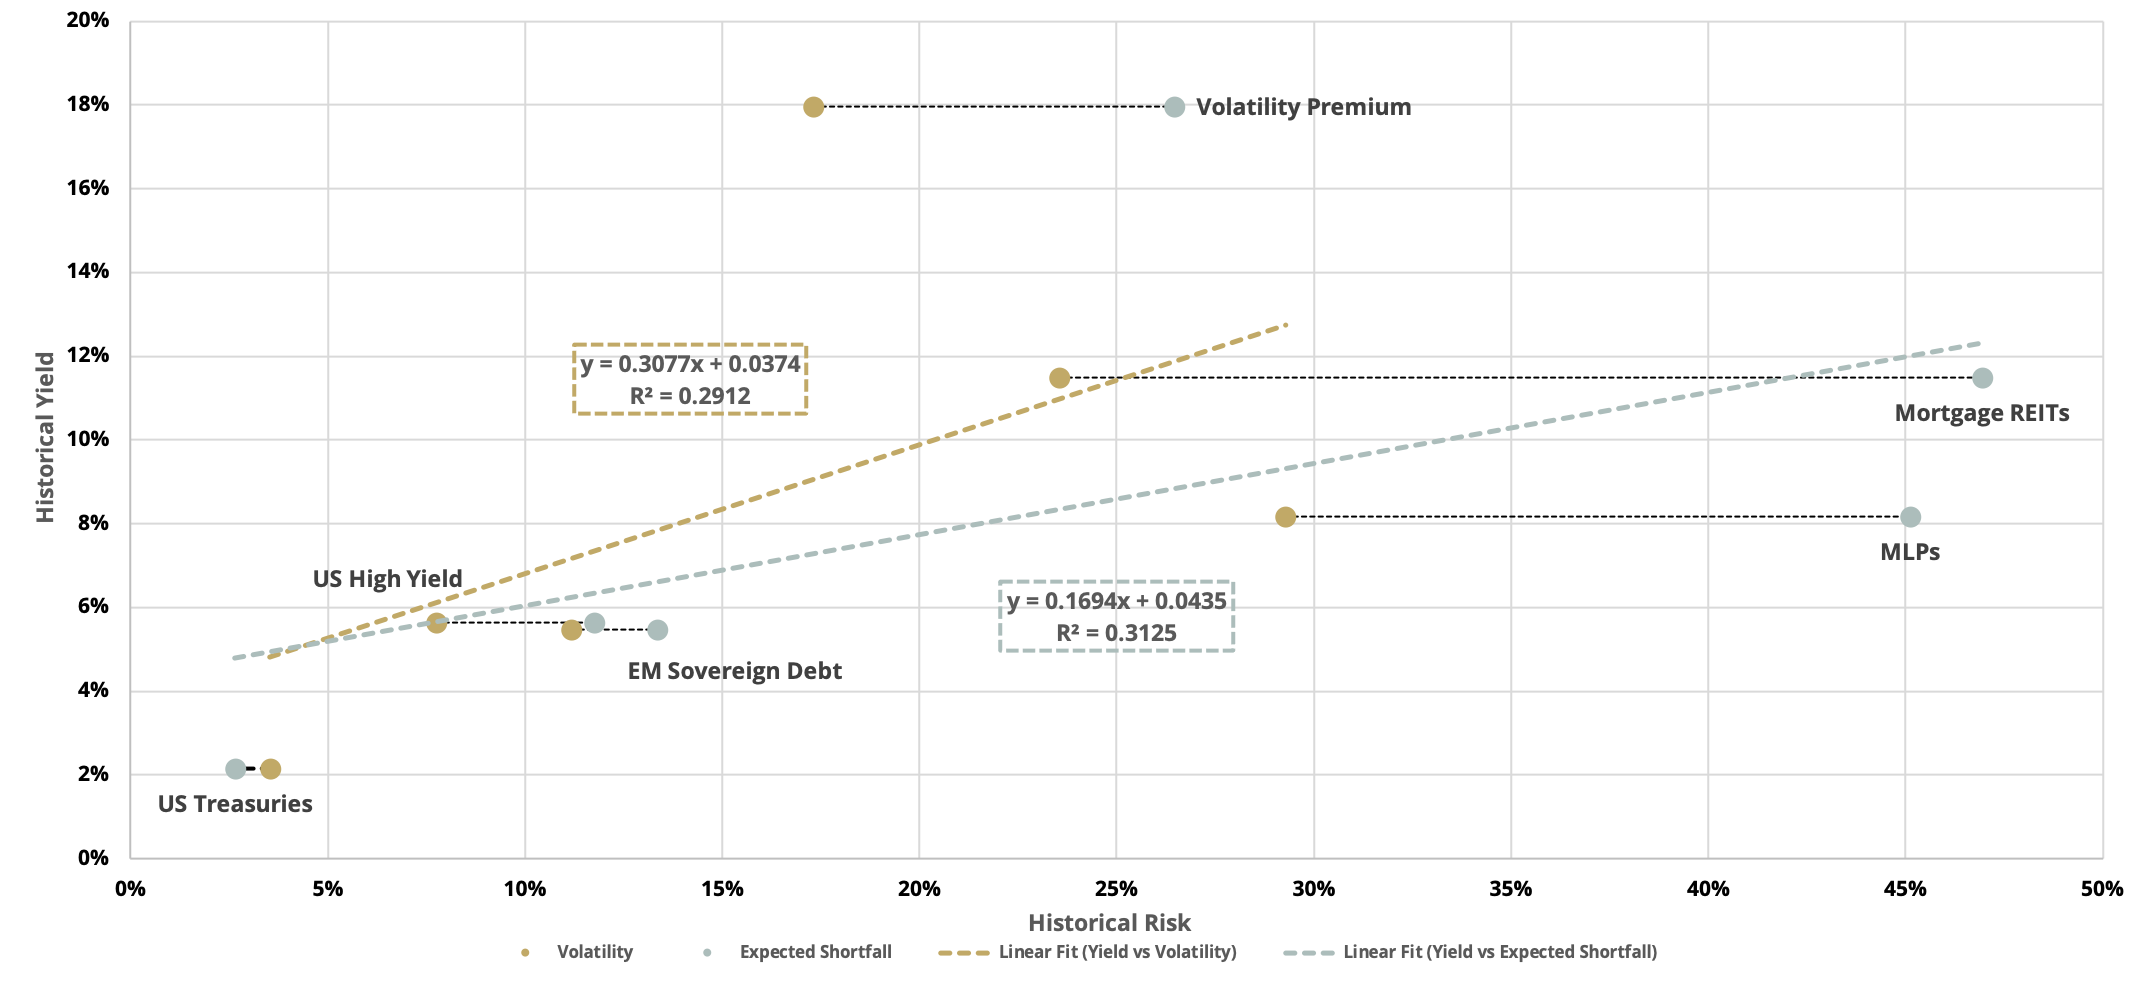
There are many metrics for measuring the left tail risk of an investment. In this blog we utilize the 1-month expected shortfall (ES) at the 99% confidence level, which is found by creating a return distribution of 20-day historical rolling returns and finding the average of returns in the worst 1% of cases. Returning to Figure 1 we see historical yield vs expected shortfall (gray dots), where we indeed see the higher income strategies are taking on some excess left-tail risk (which is exactly why we recommend the use of protective options in strategies like equity volatility harvesting). But interestingly, the volatility premium strategy is now an even more attractive outlier to the expected shortfall “security market line” relative to high income peers given their significantly larger shifts to the right in ES. Hence the attractiveness of the risk-adjusted income remains intact for the short volatility strategy, even when higher-moment CAPM is accounted for. And once again, the relatively muted r-squared of 0.31 would be a whopping 0.85 if it were not for the extreme positive outlier yield of the volatility premium strategy.
Before we move on, let’s quickly note that one can also be taking on equity correlation risk, whereby you accept increasing correlations to equities as those markets correct. This is indeed a feature of the short volatility strategy, where we see correlations slowly grow from 0.22 to 0.75 as equity markets move from strongly upward regimes to strongly downward regimes (measured over the decade ending Sept. 15, 2021). One incredibly straightforward way to neutralize this during the strategic asset allocation process is to simply include the income source within one’s equity bucket.
Tactical Asset Allocation of the Volatility Premium
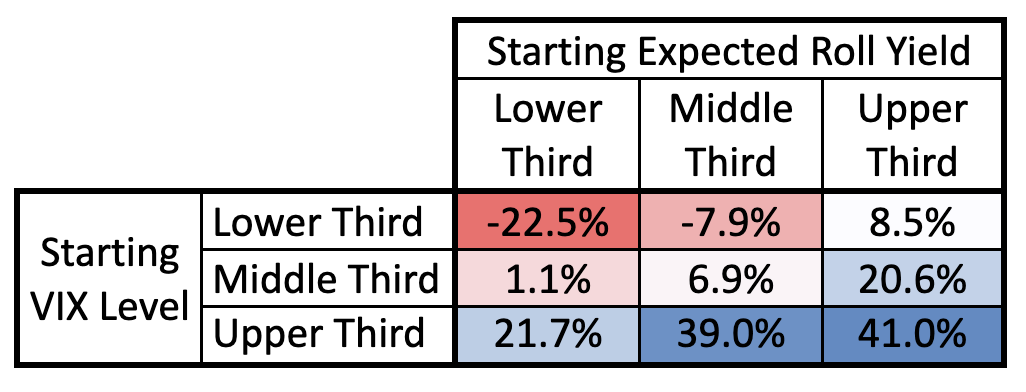
The short volatility strategy presents allocators a unique opportunity for more effective tactical positioning. Short volatility strategies deliver positive returns from two easily identified drivers: 1. mean reversion of volatility from elevated levels to average levels and 2. roll yield as second month VIX futures roll down to the front month position. Figure 2 presents the 20-day realized forward return (annualized) for the short volatility strategy as a function of starting VIX level and starting expected roll yield [4], binned into terciles (middle VIX bucket is 13.7 to 17.6; middle expected roll yield bucket is 13.2% to 26.5%). The strategy generally performs best when the curve is elevated and has room to mean revert down (driver 1) and when the curve is steep and roll yield is high (driver 2). One can thus use Figure 2 as a guide to help tactically improve the risk-adjusted income beyond the already favorable expectations highlighted in Figure 1.
Parting Words
Given current US demographics, income is a critical component of a large and growing number of portfolios. But allocators must be mindful of not only volatility risk as they reach for yield in a low-rate environment, but also potentially elevated left-tail risk. After adjusting for both volatility and tail risks, we have seen that the equity volatility premium presents a compelling risk-adjusted income stream for strategic asset allocators. We have also shown that volatility premium harvesting can be intelligently managed tactically based on starting VIX levels and starting expected roll yields.
[1] https://www.statista.com/statistics/241488/population-of-the-us-by-sex-and-age/
[2] US Treasuries are represented by LUATTRUU Index, US High Yield Bonds by HYG, Mortgage REITs by REM, MLPs by AMLP, EM Sovereign Debt by EMLC, and Equity Volatility Premium by 50% exposure to SVXY.
[3] For the short volatility strategy we assume the historical yield is equal to the average roll yield.
[4] Starting expected roll yield is calculated as (UX2-UX1)/Average(UX1,UX2)*12*0.25, where UX1 and UX2 are the front-month and second-month VIX futures contracts, respectively