A carry strategy involves repeatedly taking advantage of the difference between a spot price and a forward price, or more generally between two forward prices, for a single underlying asset. More specifically one can “ride up” a downward sloping curve to buy low and later sell high, or execute the opposite trade on an upward sloping curve, selling high and buying back low later. These term structures exist wherever sets of forward prices for an asset or an index are traded. They can be found in a broad range of asset classes including rates, credit, commodities, currencies, and option implied volatilities. Fundamentally, the investor in a carry trade is looking to earn attractive volatility-adjusted returns by providing liquidity across term structures.
Carry strategies are an intriguing tool for any asset allocator but are not widely deployed outside of institutional portfolios. In this post we review the basics of carry trades, then consider carry trades across a variety of asset classes. We then take a closer look at two historically attractive term structures -- VIX and USD rates -- and how they can be combined to produce an investment strategy with a very attractive risk-return profile.
Carry Explained
Let’s start with a simple explanation of a term structure. Term structures are tradable sets of prices for assets and indices at specific future dates. Term structures typically show values for future dates that are different from spot values due to investor preferences, and the costs and yields associated with holding cash and the underlying. When the shape of the term structure persists over time, the movement of futures prices as they converge to spot prices can provide a tailwind to returns that often exceeds the price volatility of the underlying.
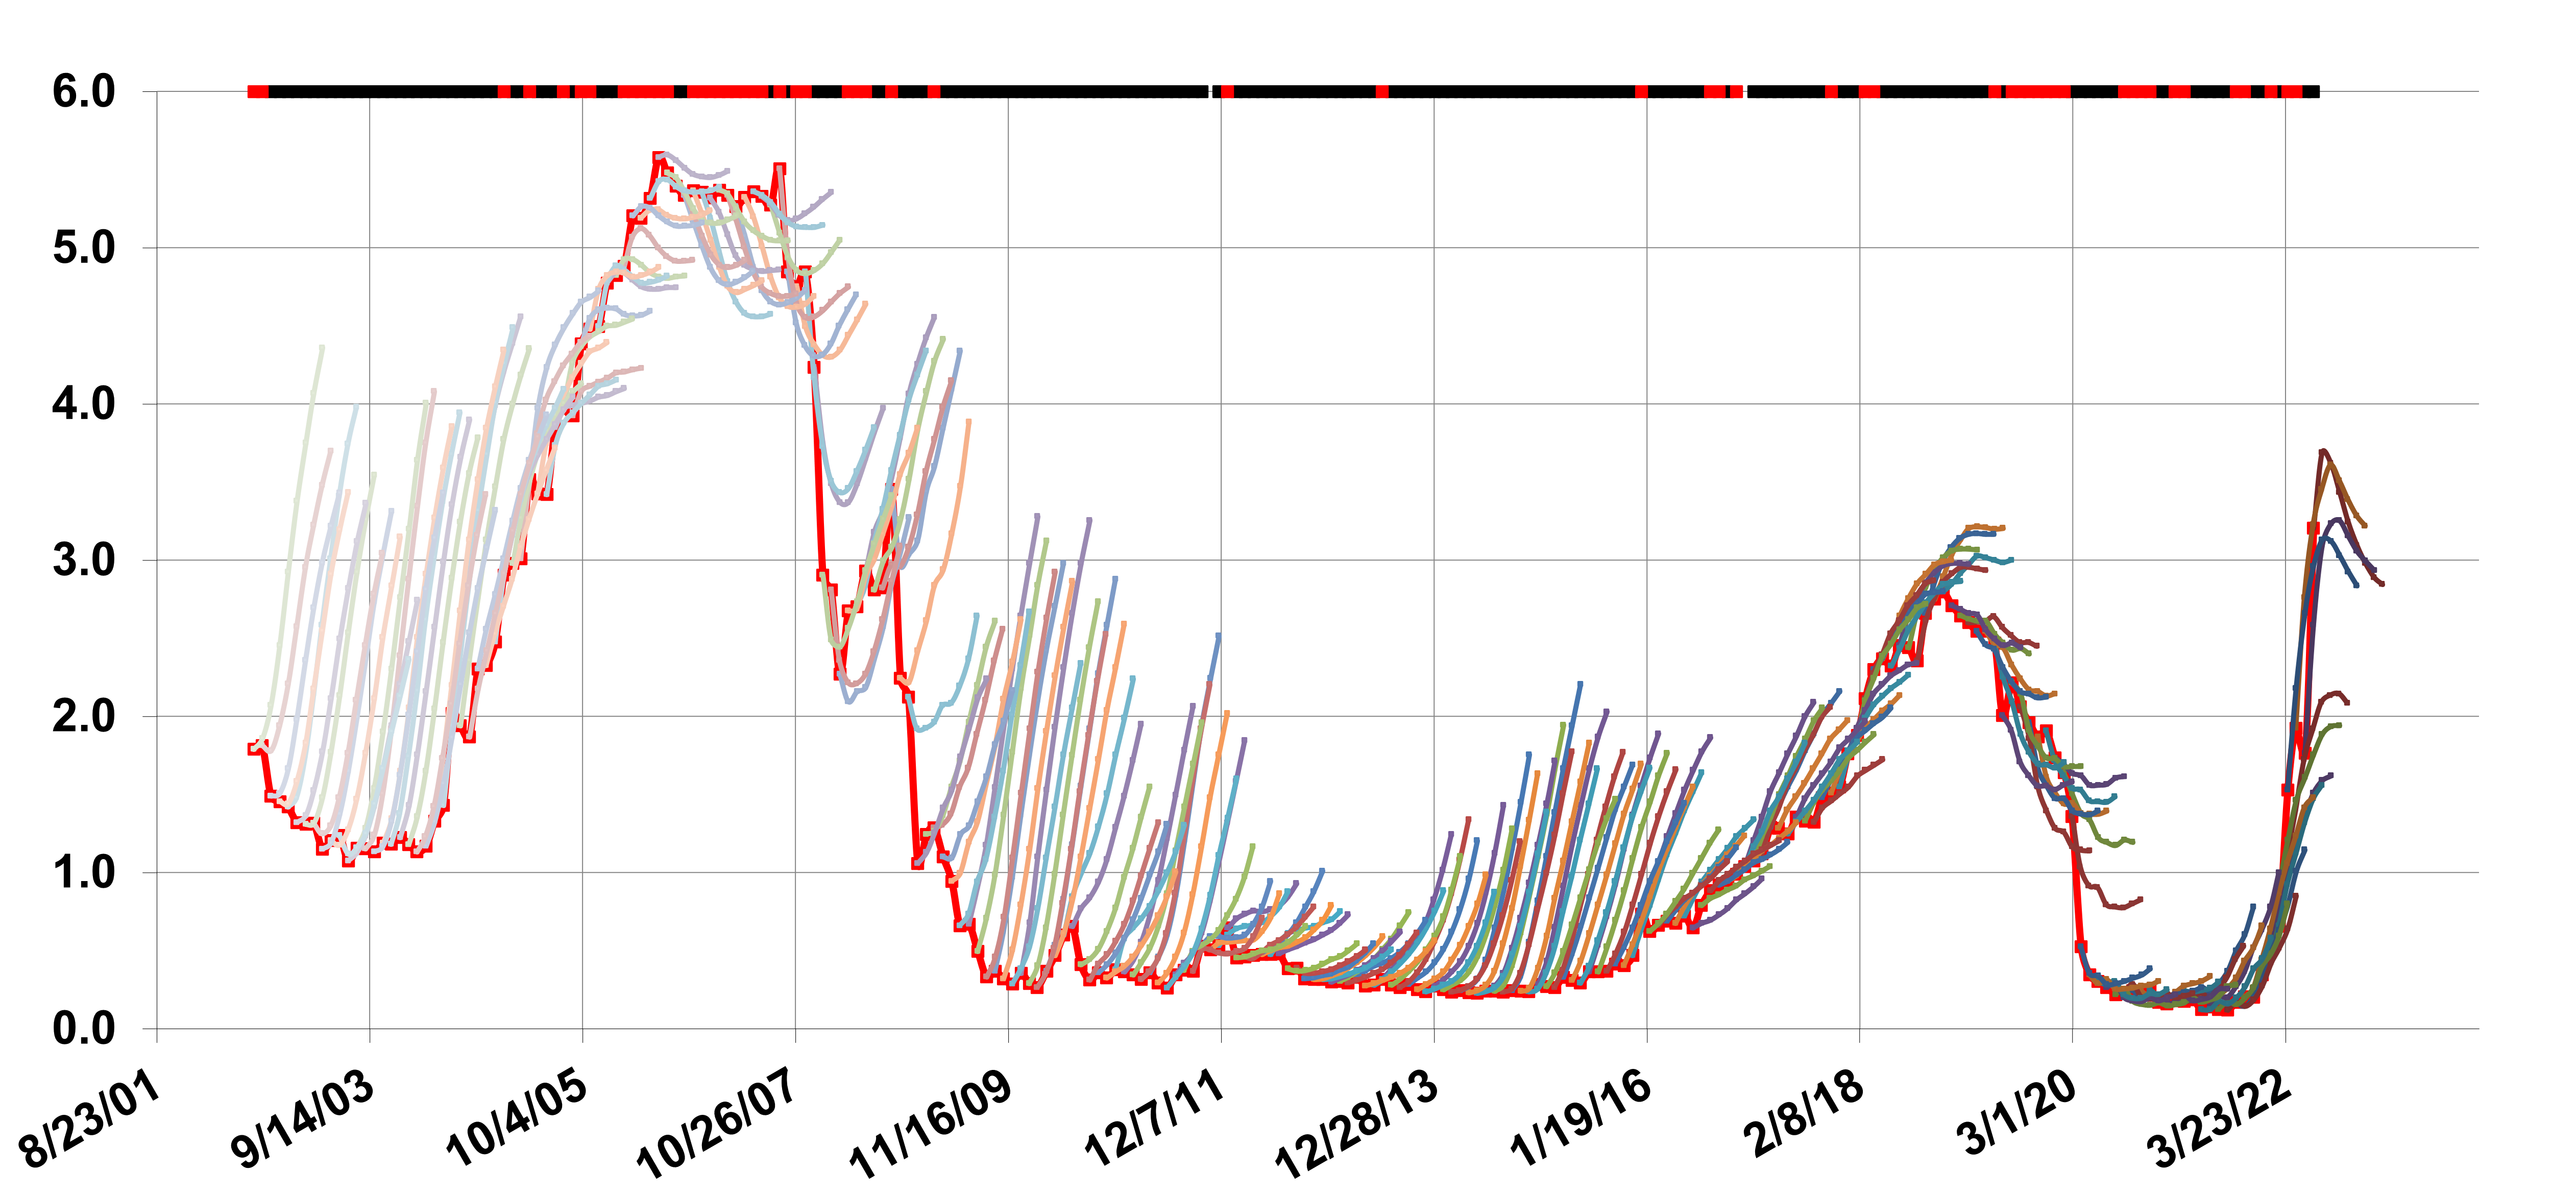
To illustrate, Figure 1 below shows the full history of the term structure for the 90 Day Eurodollar futures contract, which settles into the three-month USD LIBOR rate. The futures yield is often significantly higher than the realized or ultimately delivered yield of the contract. From October of 2009 through the end of 2015, we see that the time series for the front contract, which is closest to the delivered LIBOR rate (red line with red markers) does not go above 0.67. The forward yield of that contract (multi colored spaghetti lines), is consistently well above that level. In many cases it is more than twice that amount. Investors who had agreed to receive the forward rate, i.e. sells the forward yield (like being long the bond with that yield), would have consistently made money during that time period. Further, one can read this chart to see the profitability of a forward roll strategy. The solid horizontal bar at the top of Figure 1 shows positive or negative profitability for a simple strategy that sells the forward at the three-month forward contract price and then buys it back two months later when that contract has become the 1-month forward contract. Any time this solid horizontal bar is black, receiving the rate would have been profitable, and any time it is red, paying (opposite of receiving) the rate would have been profitable.
Figure 1: Historical Term Structure of 90 Day Eurodollar FutureSources: Simplify Asset Management; Bloomberg.
Attractiveness of Carry
There are two key features of a term structure that make for an attractive carry trade. The first is the slope of the term structure, which sets the “roll yield” i.e. the expected return of a position assuming no change in the environment. The second is persistence of a term structure i.e., the extent to which the starting roll yield is likely to be realized. Attractive carry opportunities exist in instances where we can ride term structures that have a large slope (potential for roll yield) and high persistence (a good chance that the roll will be realized).
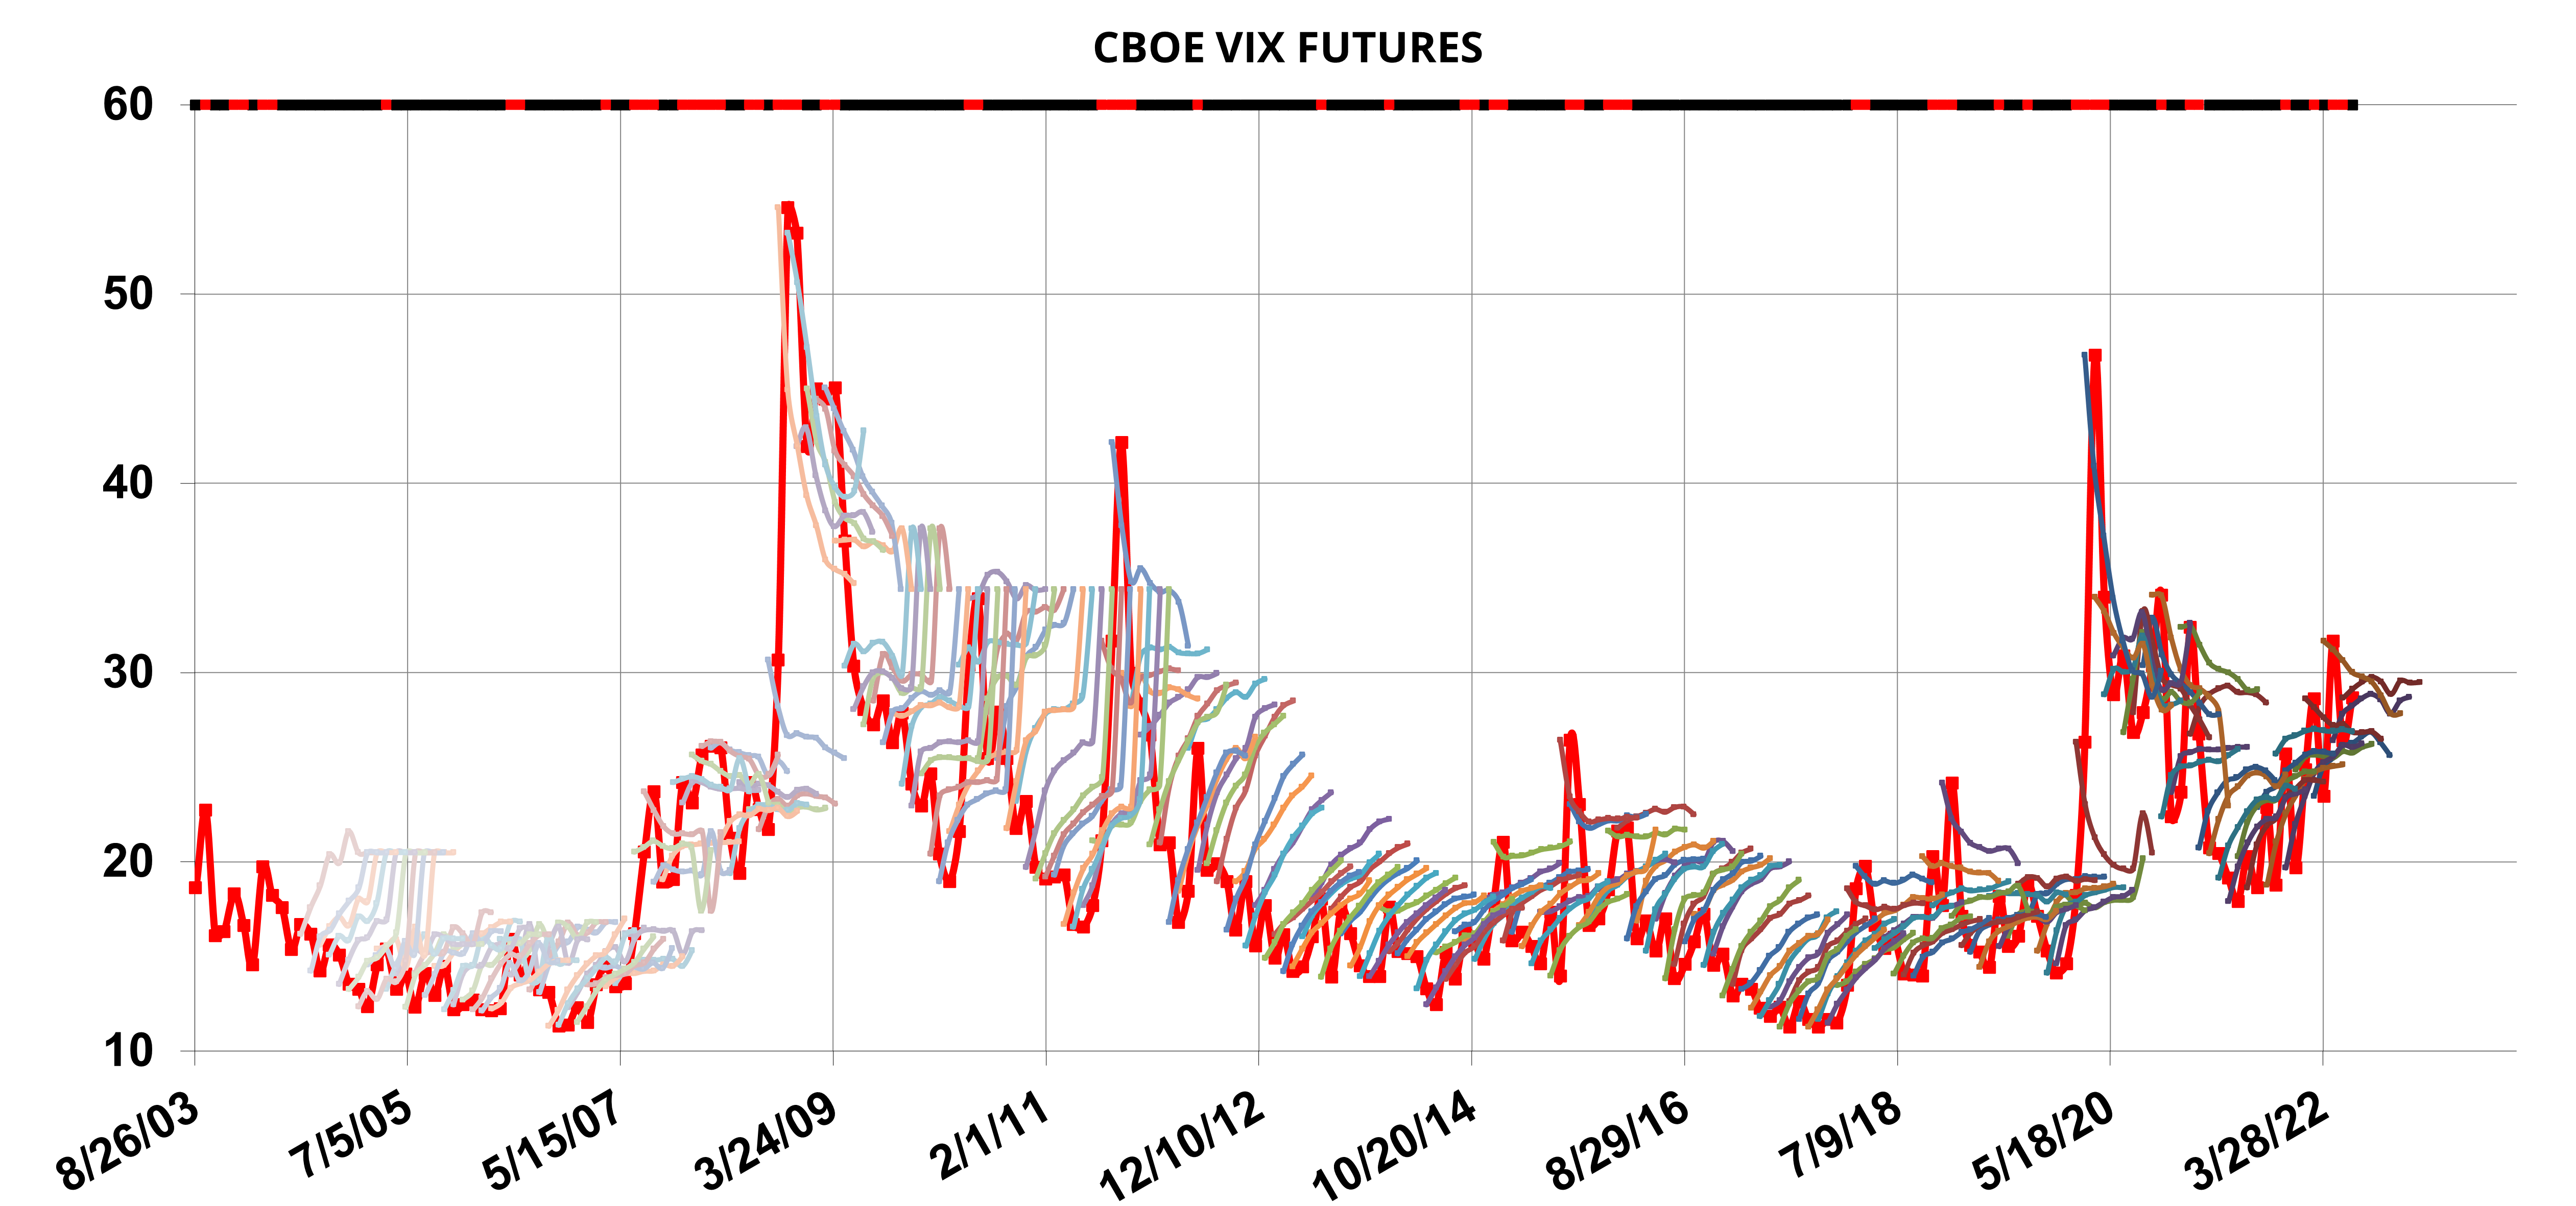
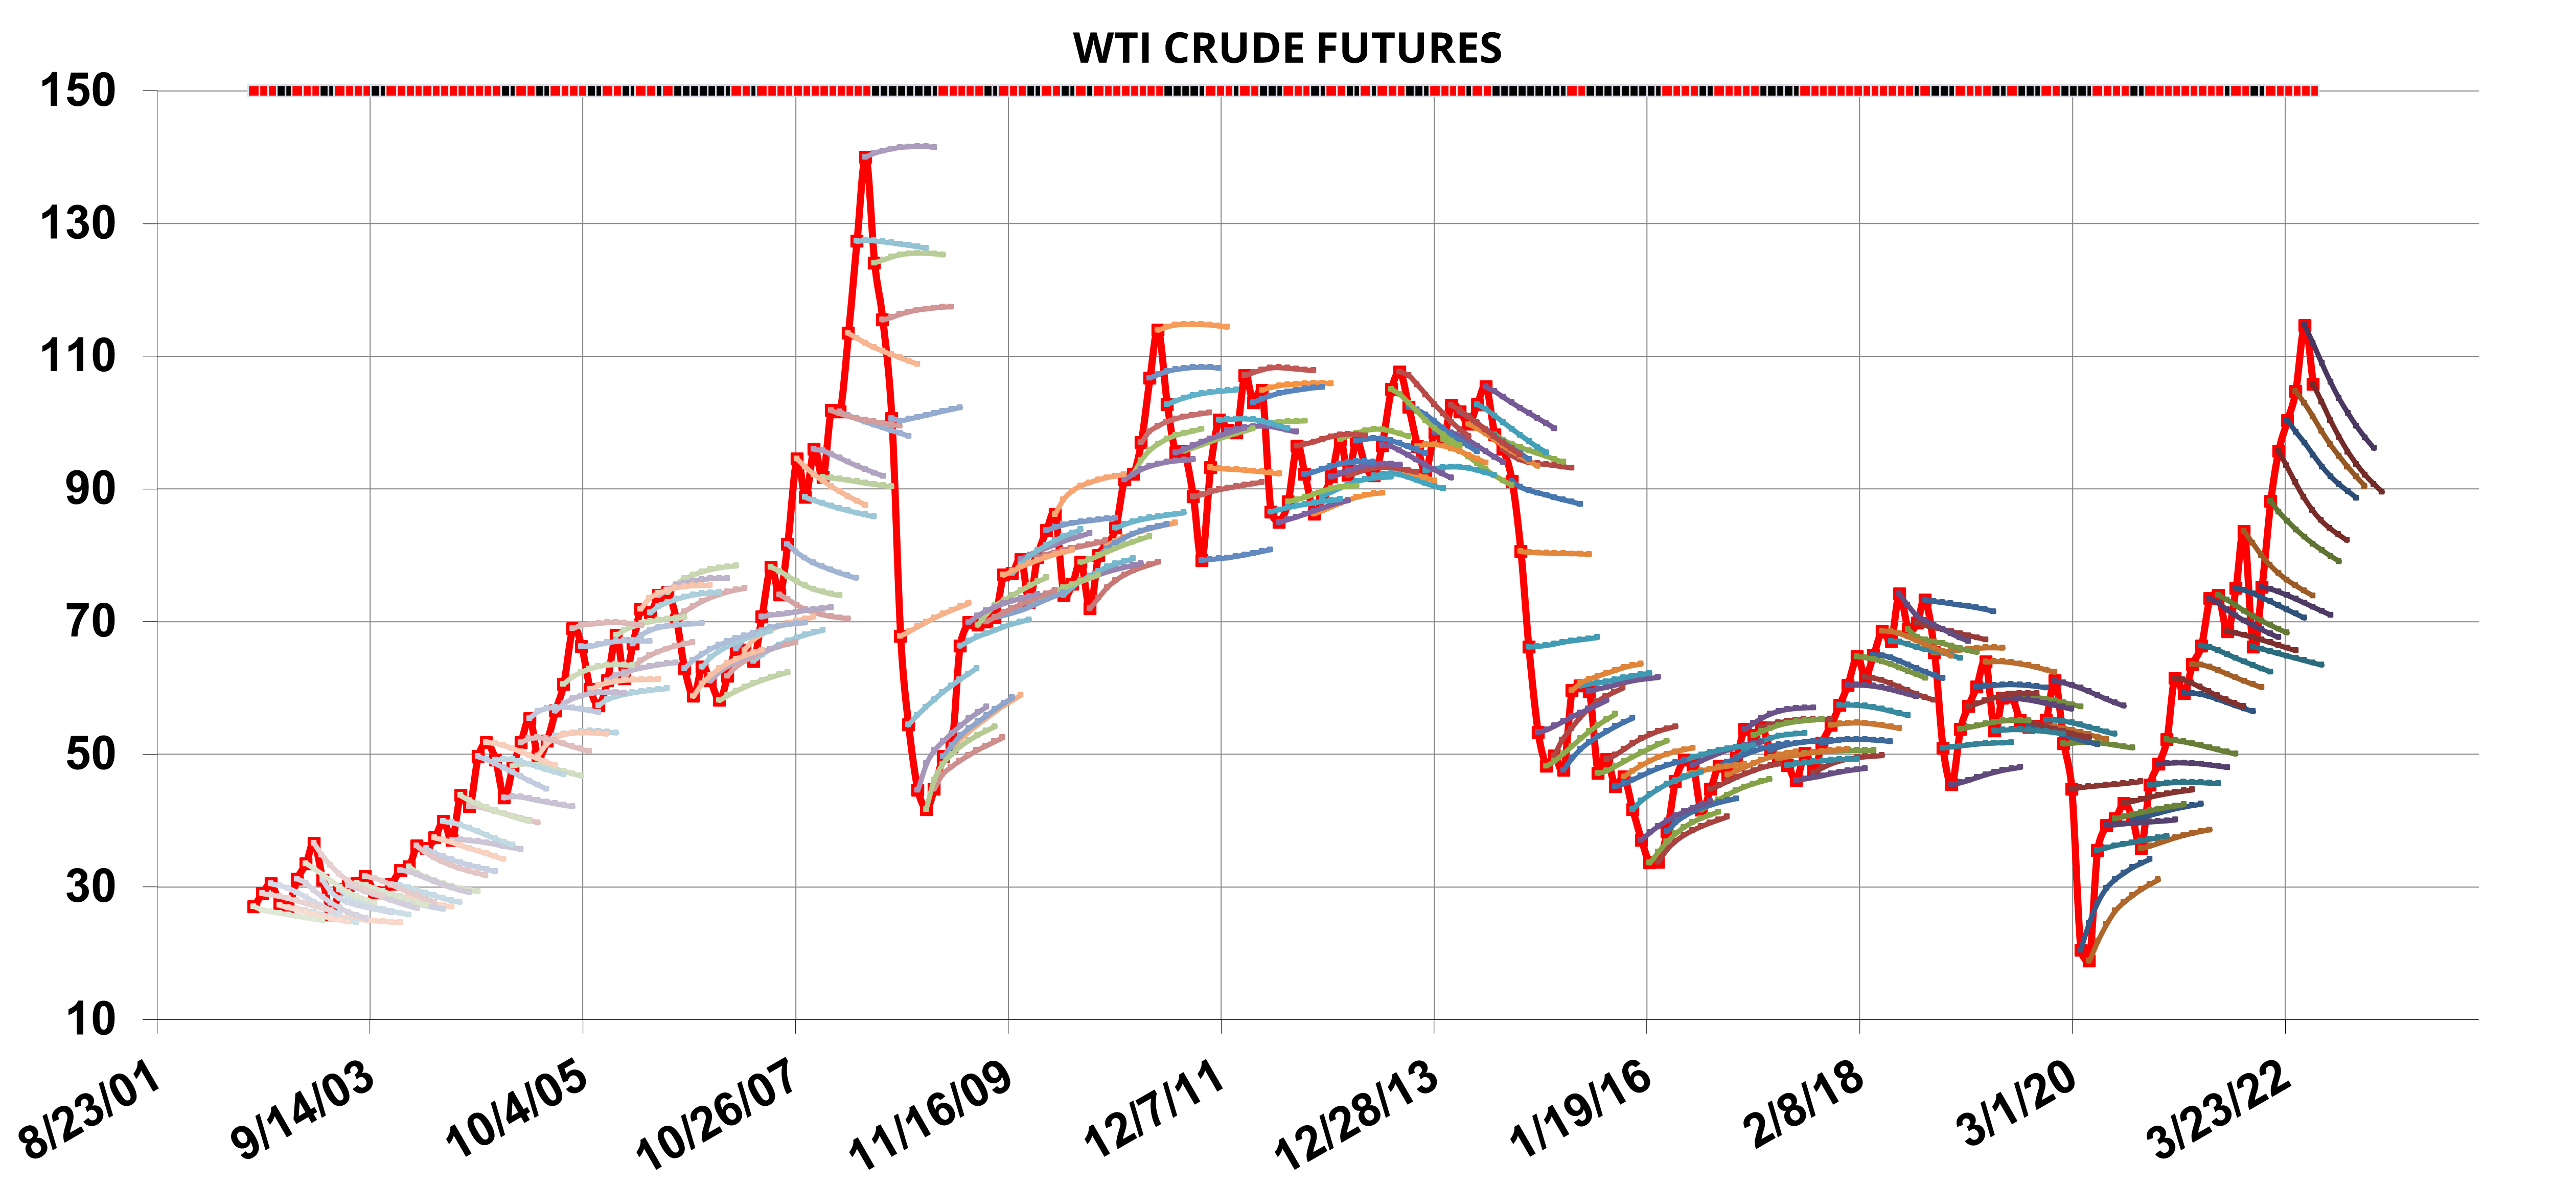
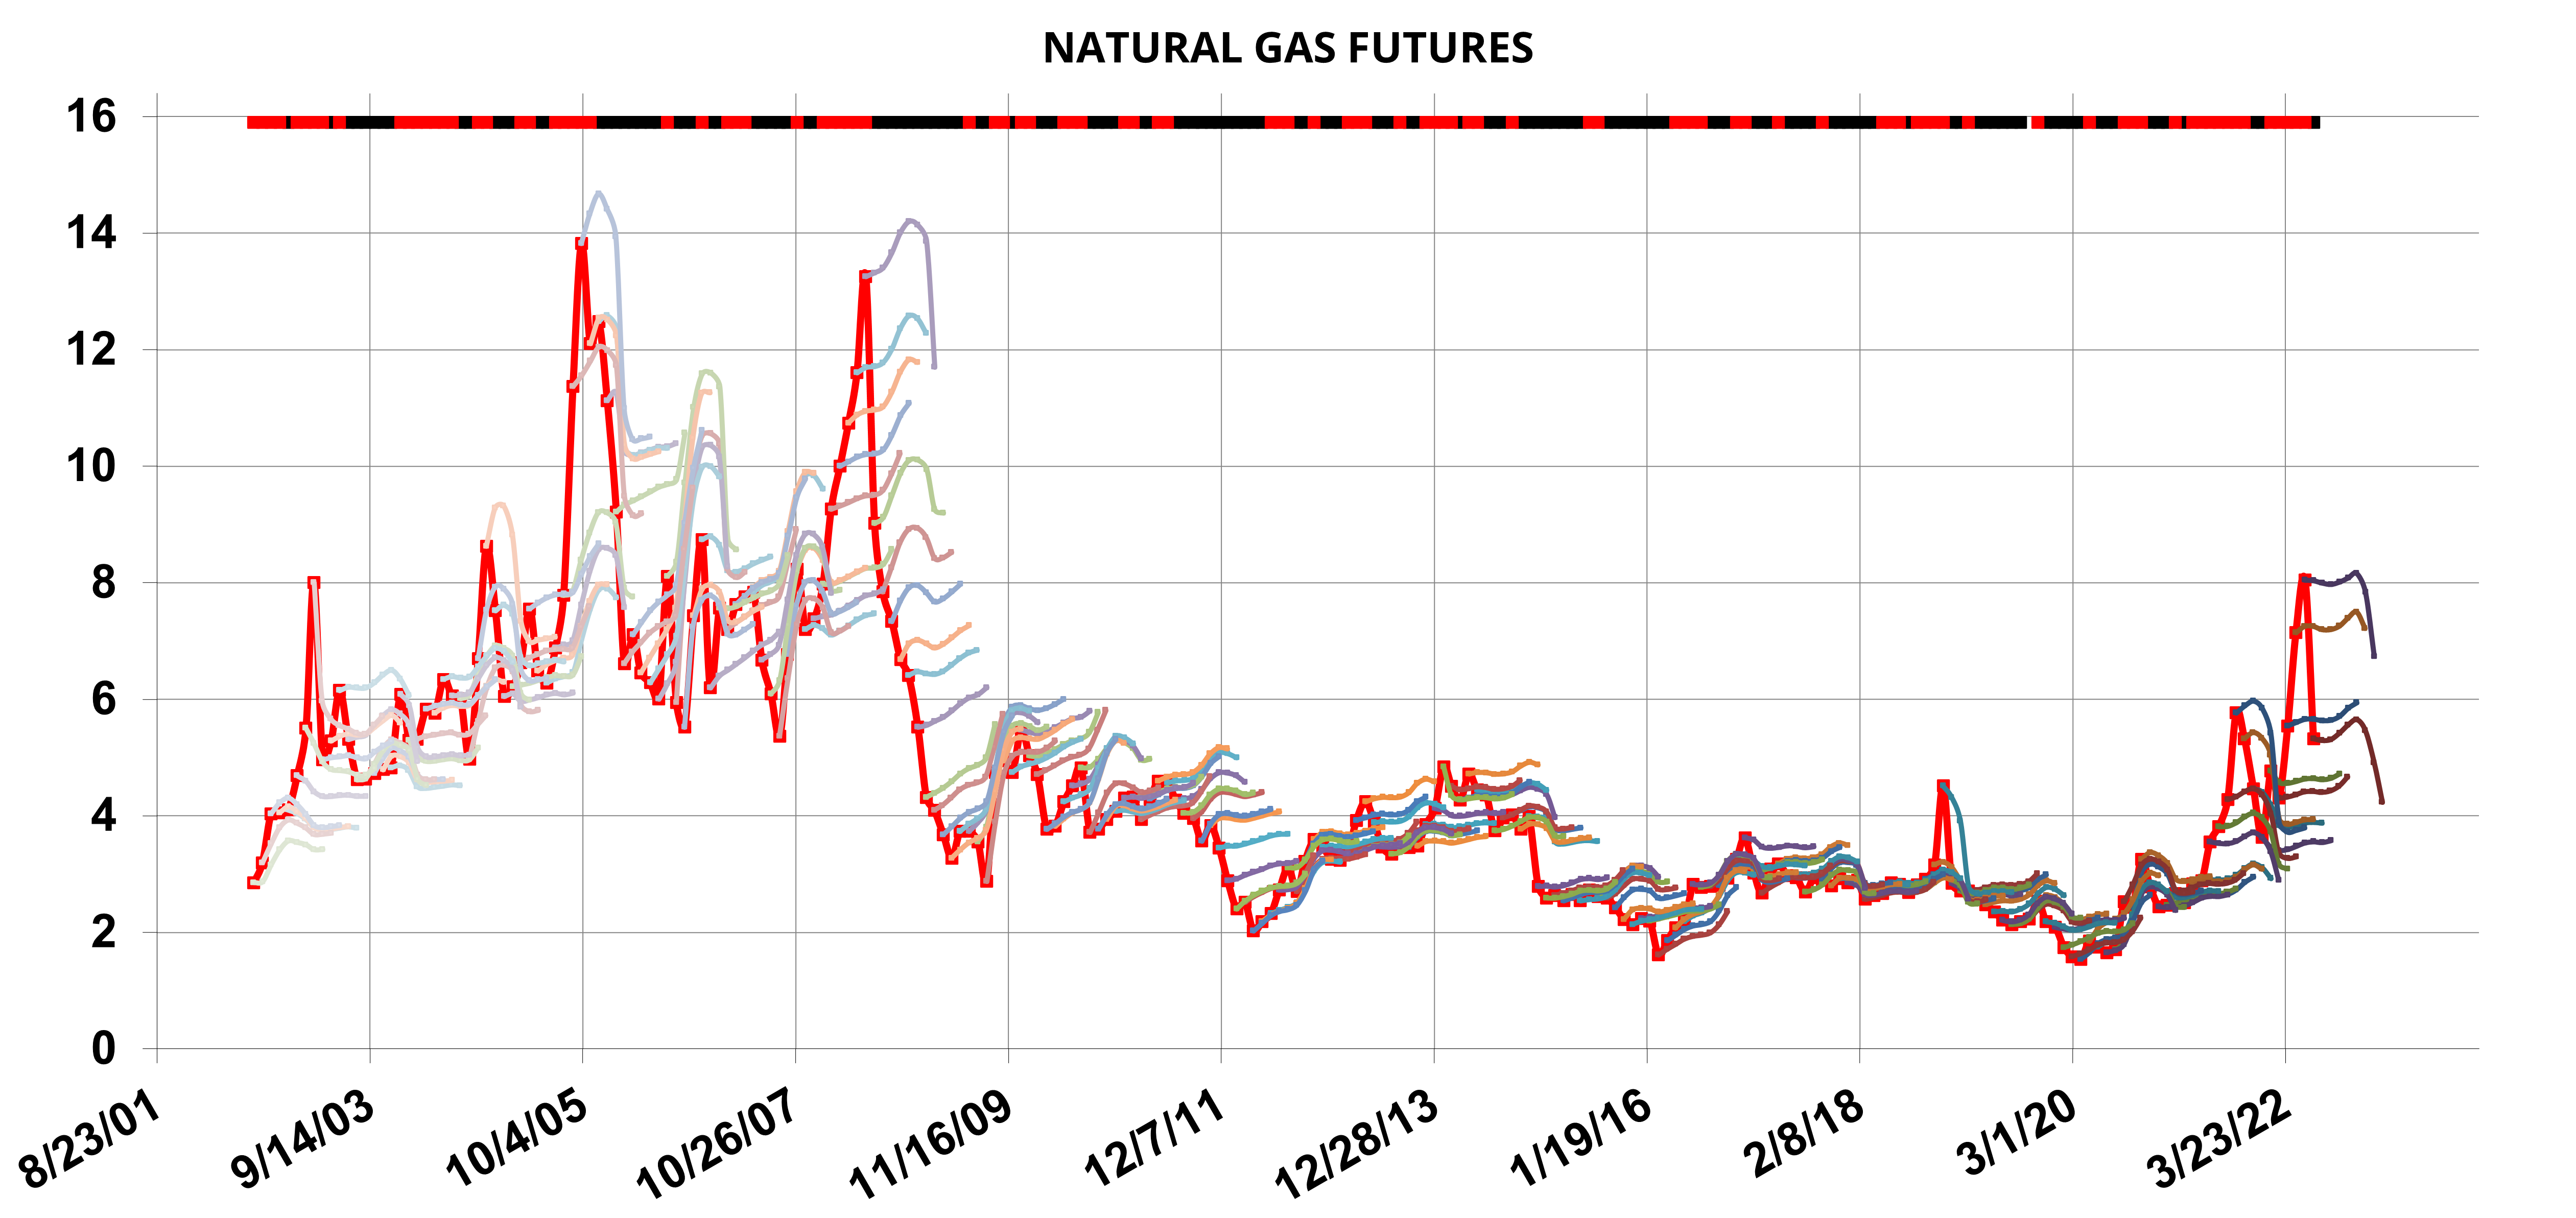
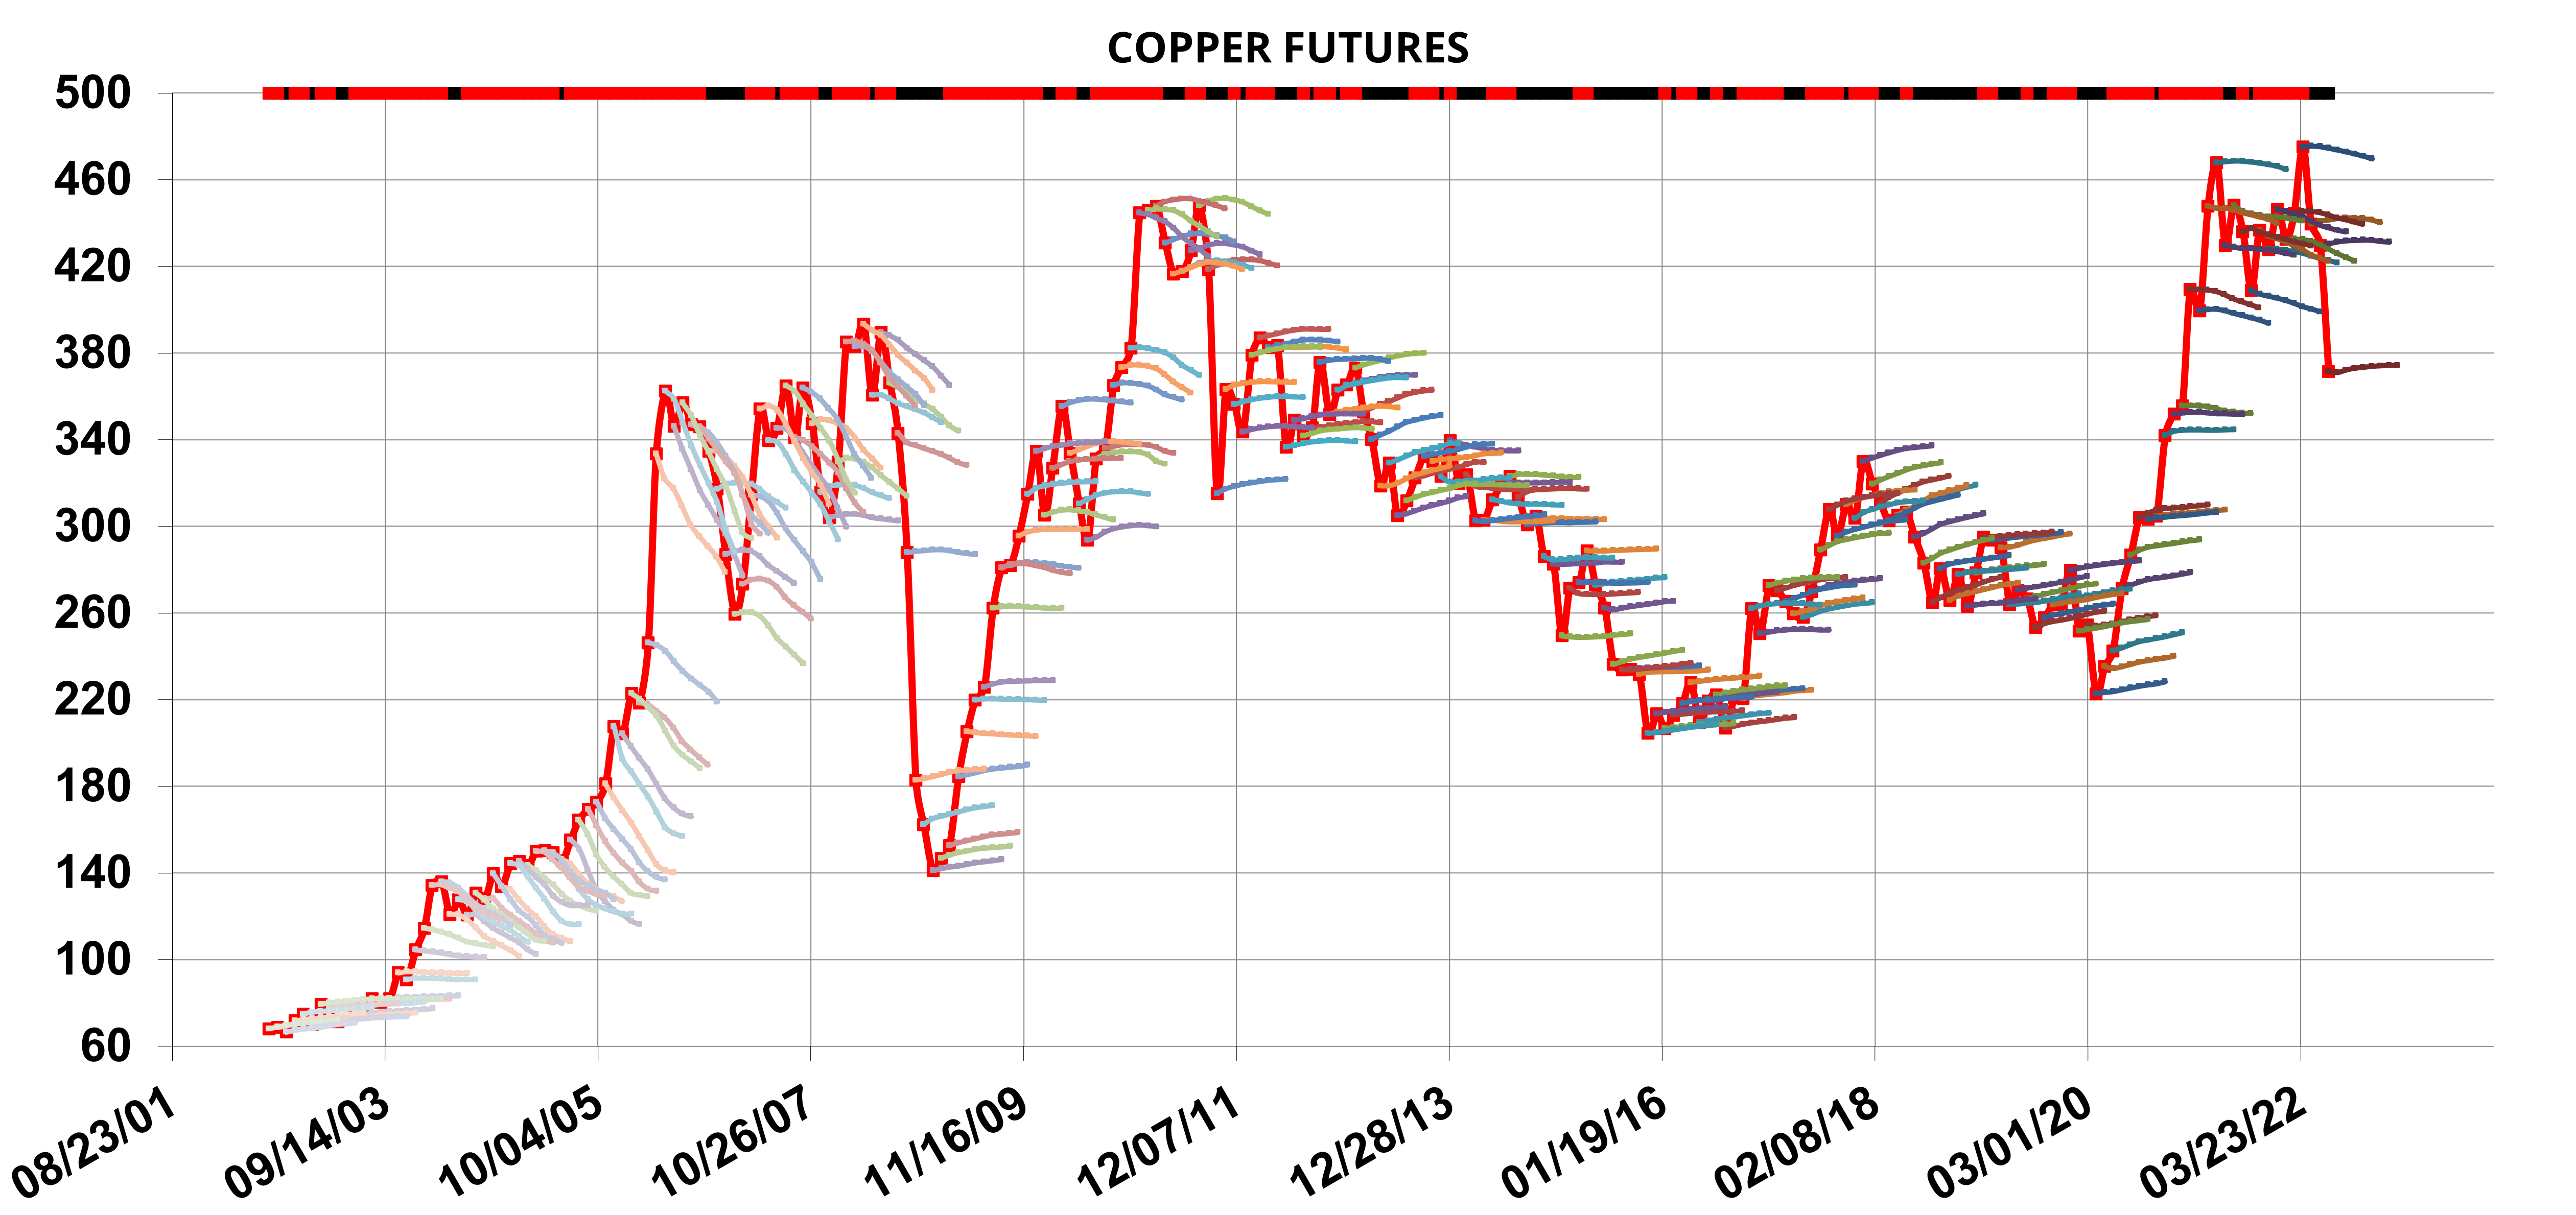
In Figure 2, we see historical term structures for the VIX Index, Crude Oil, Natural Gas and Copper. In each panel, as in Figure 1, we place the same bar at the top that is either coded black (wins) or red (loses) for a simple strategy that sells the forward at the three-month forward contract price and then buys it back two months later when that contract has become the 1-month forward contract. To the extent that this bar displays long runs and relatively infrequent changes in color gives us a crude measure of a strategy’s persistence. More precise measures can look at the volatility, and downside volatility in particular, to determine the attractiveness of a carry strategy.
Figure 2: A Few More Historical Term StructuresSources: Simplify Asset Management; Bloomberg.
Combining Carry Trades
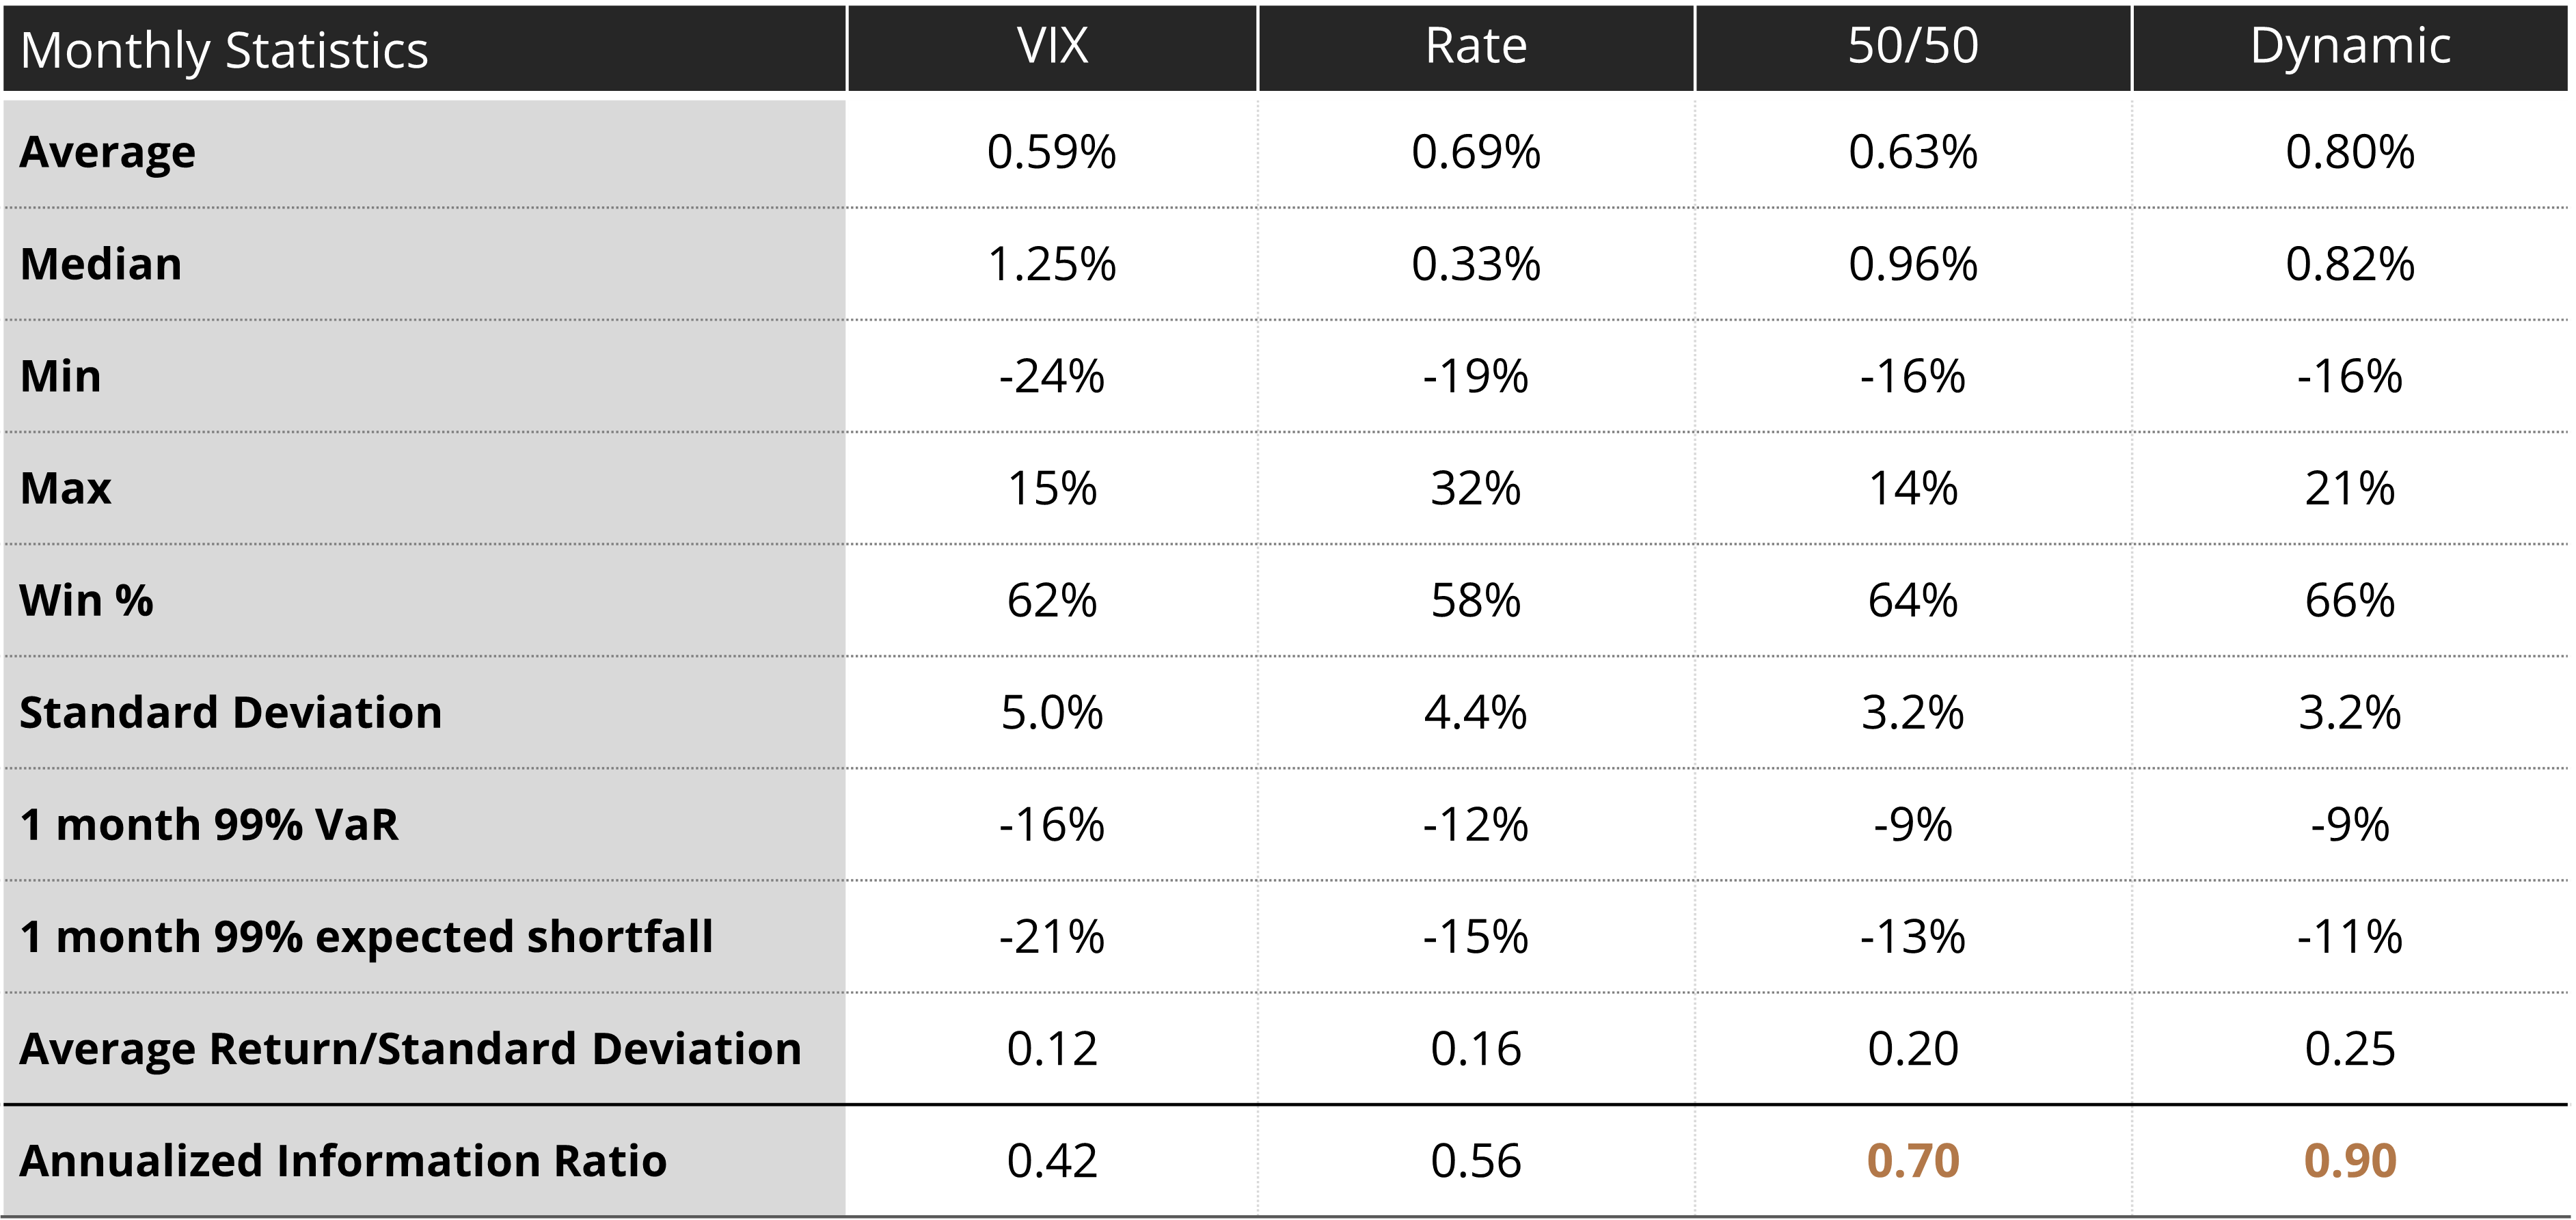
In this section, we consider two strategies in somewhat greater detail, one using VIX as the underlying and the other using the front end of the USD rates curve. These two were selected as they have demonstrated long periods of persistent and substantial roll yield. The VIX strategy shorts the front month futures contract and holds for one month, rolling equal amounts of the short to the next month each day, to keep a consistent 1-month term to expiry. The USD rate strategy receives the 1-month forward swap on 1 year LIBOR and rolls the entire position one month later. We will consider these strategies individually, in a simple equally-weighted strategy, and finally in a dynamic strategy that can overweight one over the other depending on the slope of the term structure on the entry date. For the dynamic strategy, the risk weight can be in one of three states: 75/25, 50/50 or 25/75.
Figure 3 presents the results of this work. We see attractive risk-adjusted performance for both the VIX and rate roll strategies, with both having decent realized annualized information ratios. When we combine these two in a simple naïve fashion, a 50/50 blend, we see strong improvement in risk-return metrics, including annualized information ratio, as well as expected return to VaR and expected return to Expected Shortfall. Adding in a simple decision rule to the weighting that shifts exposure between the strategies, as described above, even further improves the risk-adjusted return. As a baseline result, for instance, the dynamic weighting strategy’s annualized information ratio of 0.90 compares quite favorably with the performance of a traditional 60/40 portfolio which had an annualized information ratio of 0.72 over the same period.
Figure 3: Example of Carry Strategy PerformanceSource: Simplify Asset Management; Bloomberg. The results are hypothetical results and are NOT an indicator of future results and do NOT represent returns that any investor actually attained. Hypothetical strategies and indices presented are unmanaged, do not reflect management or trading fees, and one cannot invest directly in an index. Additional information regarding the construction of these results is available upon request. PLEASE SEE FULL DISCLOSURES BELOW.
Parting Words
Carry strategies that take advantage of the shape of forward term structures can offer very attractive risk-adjusted returns. These term structures exist across multiple asset classes, and by combining trades across these different term structures, the positive effects of diversification can help increase the attractiveness of risk-adjusted returns. We also see that even a simple dynamic allocation rule across just two term structures can further improve performance.