Equity
Equity
Is Hedged Equity a Good Replacement for the “40”?
Share

Introduction
Equity investors are drawn to the asset class with the expectation of an attractive and consistent risk premium. But with this risk premium comes the real risk of downside volatility. Traditionally, investors have paired stocks with defensive assets like bonds to provide anti-correlative benefits, but this has become increasingly more difficult in the current environment. In earlier blog posts, we explored the dismal return expectations for bonds as well as the inherent difficulty of providing portfolio protection with yields near all-time lows.
Despite a long period of success, the reliability of a traditional 60/40 portfolio of stocks and bonds faces some uncomfortable forward-looking challenges. Thankfully, the tools and strategies available to allocators have never been more accessible and wide-ranging. At Simplify, we focus on the use of options to create and modify custom return distributions, enabling investors to become more creative portfolio architects.
In this blog we will explore how one such option overlay, the costless put spread collar, can be used overtop an existing equity beta to produce a hedged equity exposure. We will also examine and review the downside and upside participation characteristics of a systematic approach to laddered monthly put spread collars, pitting the strategy against a blended stock/bond portfolio in a favorable period for the latter. Finally, we will set the table for hedged equity as a complement or replacement to the “40” in a traditional 60/40 portfolio.
Know Your Options
As an introduction to hedged equity, we will first dissect the put spread collar structure into three distinct components: long equity exposure, a short out of the money (OTM) call option, and a long (debit) put spread. This blog post will assume that long equity exposure consists of a 100% net long position in a low cost S&P 500 Index exchange traded product, although in other applications this exposure can vary in both sizing and composition. A long, slightly OTM put option is then purchased to hedge the equity exposure from downside market volatility. But hedging a 100% long equity portfolio from market corrections can be costly, eating away at the potential returns of the underlying. This is where the short option positions can play a role in balancing risk and reward. The premiums received from selling a slightly OTM call option and deep OTM put option are used to fund the long put leg, resulting in a “costless” collar that allows for a modest amount of upside participation in the underlying while simultaneously protecting against modest to severe downside market volatility. This structure provides a theoretically attractive low Beta equity position, but how does this hold up during drawdowns, and what are the opportunity costs of capping your equity upside?
Downside Dampener
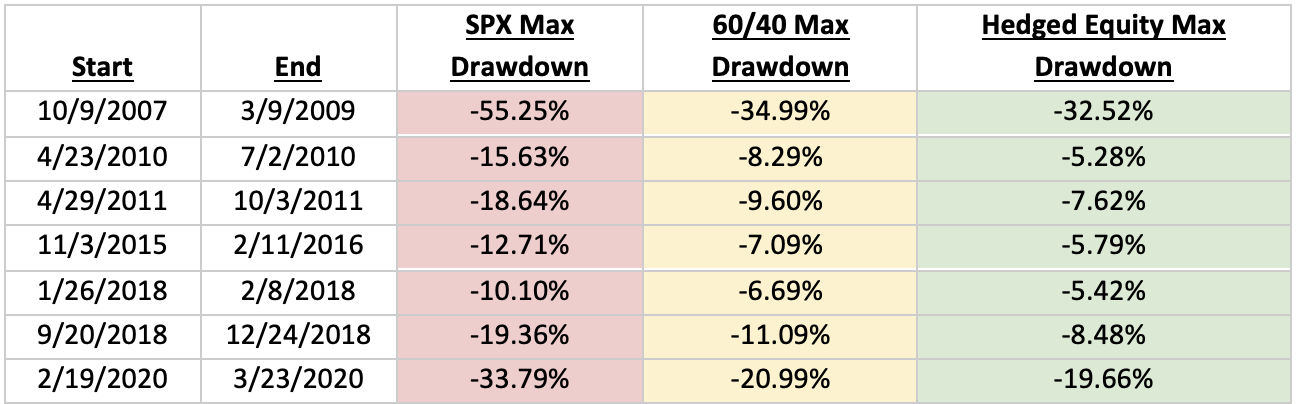
Investor preference for downside risk mitigation is the primary motivation for hedged equity strategies, but what exactly can investors expect during severe drawdowns and market corrections relative to portfolios of U.S. stocks or a 60/40 allocation using the S&P 500 and the Bloomberg Barclays Aggregate Bond Indexes? Since 2006, there have been 7 times that the S&P 500 Index has corrected (ie. fallen 10% or more) with two of the events leading to a full-blown bear market (down 20% off the recent high). Predictably, the all-stock portfolio suffered the most severe drawdowns of the three portfolios. What is more interesting is that the hedged equity portfolio (here the strategy actually has 3 quarterly legs separated by 1 month to improve path dependency vs a single quarterly leg) displayed, as shown in Figure 1, an overall better drawdown profile than a 60/40 portfolio in every assessed event.
The Cost of the Cap
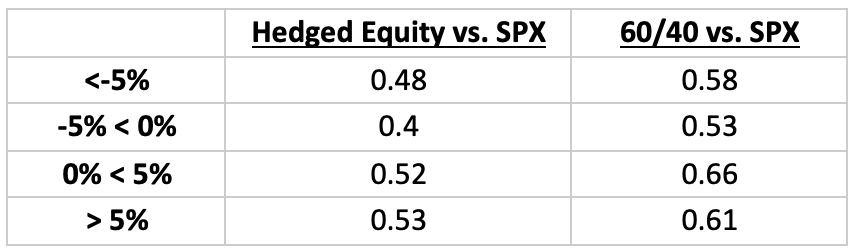
The hedged equity strategy’s costless collar proved highly effective during all major market volatility events assessed, but what was the opportunity cost for such protection? In Figure 2, we show the upside/downside capture participation ratios between the hedged equity and 60/40 portfolios versus the S&P 500 Index. During intra-month periods in which the benchmark index had negative returns, hedged equity delivered a better downside participation capture number than the 60/40 portfolio, as represented by a ratio closer to 0. However, during periods in which the benchmark was flat or positive, the hedged equity strategy participated slightly less to the upside than its 60/40 counterpart. The fundamental question one must ask regarding the upside is whether bonds can outperform an equity investment with a beta of around 0.5, as this is the ultimate expected beta of hedged equity strategies. At Simplify we believe there is a good chance that equities continue their incredible march higher, while bonds are much more challenged to the upside, hence one would favor hedged equity over the standard “40”.
12/31/2006 - 12/31/2021
How Much Upside is Left for the “40”?
In a falling rate environment similar to what we’ve experienced from 2007 to 2021, bonds have not only provided a level of downside risk mitigation to their equity counterparts but also have provided a modest level of upside participation for 60/40 portfolios. Last year, we published this blog post asking if bonds can still protect with yields near zero with the conclusion that there is an increasing opportunity cost to owning bonds in the form of return expectations and portfolio downside risk mitigation. A little over a year later, the 10-Year U.S. Treasury yield of 1.6% remains near all-time lows, painting a bleak picture for forward-looking return expectations with substantial rate risk. Amid this backdrop, hedged equity strategies may be a compelling alternative to traditional 60/40 portfolios.