SBAR Simplify Barrier Income ETF
The Simplify Barrier Income ETF (SBAR) seeks to offer a distinct source of monthly income by selling a 30-barrier put option.
In exchange for accepting the risk of a loss defined by the 30-barrier level, investors can expect higher levels of income than can be found in traditional fixed income products.
And unlike traditional bond or equity funds, the downside threshold is defined ahead of time, allowing investors to make an informed investment decision based on a quantifiable personal risk level.
Why Invest in SBAR?
How Barrier Options Work
- Barrier put options are sold with a pre-determined downside barrier (e.g. 30%)
- If the reference asset return is below the barrier at expiration, the seller fully participates in the asset's downside return (less premiums received)
- If the reference asset return is above the barrier at expiration, seller experiences no loss and premiums received are their profit
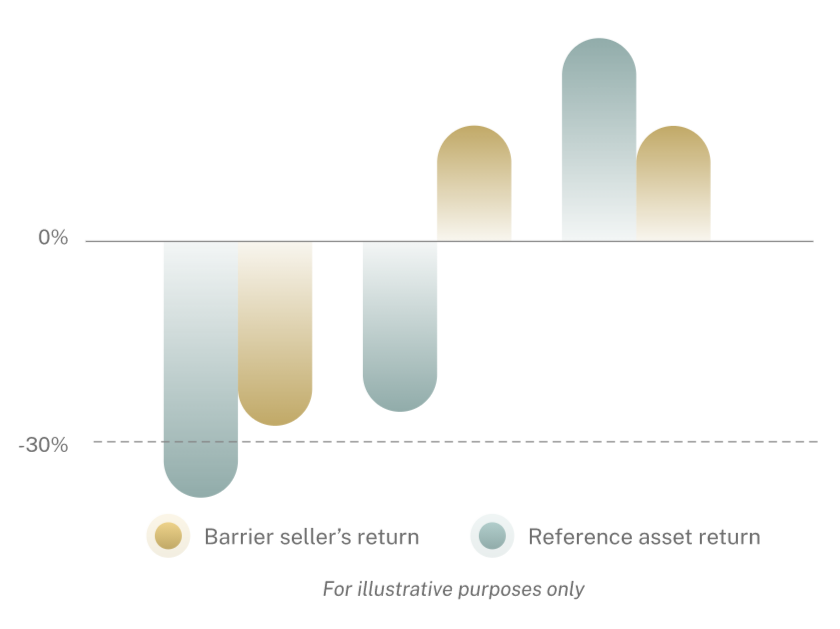
* Although a barrier option will incur no loss if the reference asset is above the barrier at expiration. in the interim period the fund's value will fluctuate as the options are continually marked to current market prices.
SBAR Spotlight
Fund Overview
As of 07/24/2026
Distribution Rate Close
Distribution rate calculation employs the most recent distribution, and multiplies the payment by 12 (monthly) or 4 (quarterly) to get an annualized total. The annualized total is then divided by the most recent net asset value (NAV) to determine the distribution rate.The Distribution Rate is the annual rate an investor would receive if the most recently declared distribution, which includes option income, remained the same going forward. The Distribution Rate is calculated by multiplying an ETF’s Distribution per Share by twelve (12), and dividing the resulting amount by the ETF’s most recent NAV. The Distribution Rate represents a single distribution from the ETF and does not represent its total return. The distribution may include a combination of ordinary dividends, capital gains, and return of investor capital and has the potential to change during any given tax year. Please refer to the 19a-1 Notice, which can be found on the Fund’s website, for information regarding the composition of distributions, including return of capital. The final determination of a distribution’s tax character will be made on Form 1099-DIV.
Management Fees
This table describes the fees and expenses that you may pay if you buy, sell, and hold shares of the Fund. Investors purchasing or selling shares of the Fund in the secondary market may be subject to costs (including customary brokerage commissions) charged by their broker. The fee table located in the prospectus and updates in prospectus supplements prevail.
| Annual Fund Operating Expenses (expenses that you pay each year as a percentage of the value of your investment) | |
|---|---|
| Management Fees | 0.75% |
| Distribution and Service (12b-1) Fees | 0.00% |
| Other Expenses1 | 0.00% |
| Total Annual Fund Operating Expenses | 0.75% |
1. Other Expenses are estimated for the Fund’s initial fiscal year.
Fund Performance (Total Return)
As of 06/30/2026 06/30/2026
| Cumulative | 1 Month | 3 Month | 6 Month | YTD | 1 Year | 3 Year | 5 Year | Since Inception |
|---|---|---|---|---|---|---|---|---|
| NAV | 1.10% | 7.39% | 4.21% | 4.21% | 11.00% | — | — | 18.23% |
| Market Price | 1.38% | 7.43% | 3.89% | 3.89% | 10.53% | — | — | 18.21% |
| Annualized | 1 Year | 3 Year | 5 Year | Since Inception |
|---|---|---|---|---|
| NAV | 11.00% | — | — | 14.83% |
| Market Price | 10.53% | — | — | 14.85% |
| Cumulative | 1 Year | 3 Year | 5 Year | Since Inception |
|---|---|---|---|---|
| NAV | 11.00% | — | — | 18.23% |
| Market Price | 10.53% | — | — | 18.21% |
| Annualized | 1 Year | 3 Year | 5 Year | Since Inception |
|---|---|---|---|---|
| NAV | 11.00% | — | — | 14.83% |
| Market Price | 10.53% | — | — | 14.85% |
| Calendar Year | NAV | Market Price |
|---|---|---|
| 2025 | — | — |
The performance data quoted represents past performance and is no guarantee of future results. Current performance may be lower or higher than the performance data quoted. Investment returns and principal value of an investment will fluctuate so that an investor's shares, when redeemed, may be worth more or less than their original cost. Performance data for the most recent month-end is available above.
NAV: The dollar value of a single share, based on the value of the underlying assets of the fund minus its liabilities, divided by the number of shares outstanding. Calculated at the end of each business day.
Market Price: The current price at which shares are bought and sold. Market returns are based upon the last trade price.
Growth of $10,000
The Growth of $10,000 chart reflects a hypothetical investment and assumes reinvestment of dividends and capital gains. Fund expenses, including management fees and other expenses were deducted. Results are not indicative of future performance.
The above frequency distribution chart presents information about the difference between the daily market price for shares of the Fund and the Fund's reported Net Asset Value. The amount that the Fund's market price is above the reported NAV is called the premium. The amount that the Fund's market price is below the reported NAV is called the discount. The market price is determined using the midpoint between the highest bid and the lowest offer on the listing exchange, as of the time that the Fund's NAV is calculated (usually 4:00 p.m. EST). The horizontal axis of the chart shows the premium or discount expressed in basis points. The vertical axis indicates the number of trading days in the period covered by the chart. Each bar in the chart shows the number of trading days in which the Fund traded within the premium/discount range indicated.
Portfolio Holdings
| Ticker | Name | Quantity | Weight |
|---|---|---|---|
| SBIL | SIMPLIFY E GOVT MONEY MKT ETF | 3,391,208 | 84.58% |
| OTC CI1 SPX/RTY/NDX WOF 06/04/27 P100%/70% NC3 EKI | OTC Jun 2027 100 Put | -10,000,000 | -0.10% |
| OTC CI1 SPX/RTY/NDX WOF 07/02/27 P100%/70% NC3 EKI | OTC Jul 2027 100 Put | -30,000,000 | -0.36% |
| OTC CI1 SPX/RTY/NDX WOF 07/09/27 P100%/70% NC3 EKI | OTC Jul 2027 100 Put | -5,000,000 | -0.06% |
| OTC CI2 SPX/RTY/NDX WOF 07/09/27 P100%/70% NC3 EKI | OTC Jul 2027 100 Put | -30,000,000 | -0.31% |
| OTC HS1 SPX/RTY/NDX WOF 04/30/27 P100%/70% NC3 EKI | OTC Jan 0001 100 Put | — | — |
| OTC HS1 SPX/RTY/NDX WOF 05/07/27 P100%/70% NC3 EKI | OTC May 2027 100 Put | -20,000,000 | -0.20% |
| OTC HS1 SPX/RTY/NDX WOF 05/14/27 P100%/70% NC3 EKI | OTC May 2027 100 Put | -25,000,000 | -0.25% |
| OTC HS1 SPX/RTY/NDX WOF 05/28/27 P100%/70% NC3 EKI | OTC May 2027 100 Put | -5,000,000 | -0.07% |
| OTC HS1 SPX/RTY/NDX WOF 06/04/27 P100%/70% NC3 EKI | OTC Jun 2027 100 Put | -5,000,000 | -0.06% |
| OTC HS1 SPX/RTY/NDX WOF 06/17/27 P100%/70% NC3 EKI | OTC Jun 2027 100 Put | -6,500,000 | -0.09% |
| OTC HS1 SPX/RTY/NDX WOF 06/25/27 P100%/70% NC3 EKI | OTC Jun 2027 100 Put | -17,500,000 | -0.22% |
| OTC HS1 SPX/RTY/NDX WOF 07/09/27 P100%/70% NC3 EKI | OTC Jul 2027 100 Put | -20,000,000 | -0.27% |
| OTC HS1 SPX/RTY/NDX WOF 07/16/27 P100%/70% NC3 EKI | OTC Jul 2027 100 Put | -10,000,000 | -0.13% |
| OTC HS2 SPX/RTY/NDX WOF 04/30/27 P100%/70% NC3 EKI | OTC May 2027 100 Put | -20,000,000 | -0.18% |
| OTC HS2 SPX/RTY/NDX WOF 05/07/27 P100%/70% NC3 EKI | OTC May 2027 100 Put | -8,000,000 | -0.07% |
| OTC HS2 SPX/RTY/NDX WOF 05/14/27 P100%/70% NC3 EKI | OTC May 2027 100 Put | -5,000,000 | -0.05% |
| OTC HS2 SPX/RTY/NDX WOF 05/28/27 P100%/70% NC3 EKI | OTC May 2027 100 Put | -5,000,000 | -0.07% |
| OTC HS2 SPX/RTY/NDX WOF 06/04/27 P100%/70% NC3 EKI | OTC Jun 2027 100 Put | -10,000,000 | -0.13% |
| OTC HS2 SPX/RTY/NDX WOF 07/09/27 P100%/70% NC3 EKI | OTC Jul 2027 100 Put | -2,000,000 | -0.03% |
| OTC HS2 SPX/RTY/NDX WOF 07/16/27 P100%/70% NC3 EKI | OTC Jul 2027 100 Put | -3,000,000 | -0.04% |
| OTC HS3 SPX/RTY/NDX WOF 04/30/27 P100%/70% NC3 EKI | OTC May 2027 100 Put | -20,000,000 | -0.21% |
| OTC HS3 SPX/RTY/NDX WOF 05/07/27 P100%/70% NC3 EKI | OTC May 2027 100 Put | -18,000,000 | -0.20% |
| OTC HS3 SPX/RTY/NDX WOF 05/14/27 P100%/70% NC3 EKI | OTC May 2027 100 Put | -10,000,000 | -0.09% |
| OTC HS3 SPX/RTY/NDX WOF 07/09/27 P100%/70% NC3 EKI | OTC Jul 2027 100 Put | -6,000,000 | -0.08% |
| OTC HS3 SPX/RTY/NDX WOF 07/16/27 P100%/70% NC3 EKI | OTC Jul 2027 100 Put | -7,000,000 | -0.10% |
| OTC HS4 SPX/RTY/NDX WOF 05/07/27 P100%/70% NC3 EKI | OTC May 2027 100 Put | -18,000,000 | -0.20% |
| OTC HS4 SPX/RTY/NDX WOF 05/14/27 P100%/70% NC3 EKI | OTC May 2027 100 Put | -6,500,000 | -0.07% |
| OTC HS4 SPX/RTY/NDX WOF 07/16/27 P100%/70% NC3 EKI | OTC Jul 2027 100 Put | -20,000,000 | -0.19% |
| OTC HS5 SPX/RTY/NDX WOF 05/14/27 P100%/70% NC3 EKI | OTC May 2027 100 Put | -8,500,000 | -0.09% |
| OTC NM1 SPX/RTY/NDX WOF 05/07/27 P100%/70% NC3 EKI | OTC May 2027 100 Put | -15,000,000 | -0.16% |
| OTC NM1 SPX/RTY/NDX WOF 05/28/27 P100%/70% NC3 EKI | OTC May 2027 100 Put | -12,000,000 | -0.12% |
| OTC NM1 SPX/RTY/NDX WOF 07/02/27 P100%/70% NC3 EKI | OTC Jul 2027 100 Put | -2,000,000 | -0.03% |
| OTC NM3 SPX/RTY/NDX WOF 04/30/27 P100%/70% NC3 EKI | OTC May 2027 100 Put | -12,500,000 | -0.13% |
| SPXW | JULY 26 PUTS ON SPX 7250.000000 | — | — |
| SPXW | JULY 26 PUTS ON SPX 7300.000000 | — | — |
| SPXW | JULY 26 PUTS ON SPX 6100.000000 | 471 | 0.00% |
| T Bills | UNITED STS TREAS BILLS 0.0 01SEP26 | 7,000,000 | 1.73% |
| T Bills | UNITED STS TREAS BILLS 0.0 15OCT26 | 16,630,000 | 4.10% |
| T Bills | UNITED STS TREAS BILLS 0.0 03DEC26 | 19,660,000 | 4.82% |
| T Bills | UNITED STS TREAS BILLS 0.0 31DEC26 | 33,970,000 | 8.30% |
| - | Estimated Cash | 3,235,519 | 0.80% |
Holdings are subject to change without notice.
Recent Distributions
| Ex-Dividend Date | Record Date | Payable Date | Total Distribution |
|---|---|---|---|
| N/A | |||
| $0.25000 | |||
| $0.25000 | |||
| $0.25000 | |||
| $0.25000 |

