Investment portfolios are built around equities, as they have produced exceptionally high and robust returns over extended periods, and are generally expected to continue to offer an attractive risk premium to those who are willing to accept the risks they carry. But we all know it is not prudent to put all your eggs in one basket, so we diversify our equity-centric portfolios into other assets. The primary asset people use for diversifying their core equity holding is bonds, which for simplicity we will assume for the rest of this discussion is a 30 Year Treasury bond. Bonds are indeed anti-correlated with equities in typical market environments and are generally expected to hold their par value in times of stress, providing a floor to the total assets at risk in a portfolio.
But there is a cost to this protection, and that cost fluctuates in time. Over the last 50 years, a constant maturity 30 Year Treasury bond holding has returned an average of about 8% annually, while the S&P 500 averaged about 11%. Hence over the past half-century bonds were an attractive way to protect the portfolio given their relatively modest 3% opportunity cost relative to equities. But when yields are very low, as they are today, the expected cost of holding Treasuries relative to equities can rise substantially above the 3% opportunity cost, which brings into question whether they still fit the bill as the go-to choice for diversifying equity-dominated portfolios.
A Modern Solution
No matter how you cut it, risk management at the portfolio level is ultimately about not losing your shirt. Are there other ways to protect against severe losses without diversifying into a completely different asset class like bonds, whose expected risk premium may be temporarily muted for good reasons? Enter equity options. Long a niche tool of professional traders and money managers, options are only now being seriously explored as a compelling tool to manage downside risk in a wealth management context. In particular, put options on the equity market have the potential to pay the holder handsomely when markets experience a downturn, offering a distinct way of protecting an equity-focused portfolio against severe losses beyond the traditional method of diversifying into other asset classes like bonds.
And there are a number of other intriguing aspects of protecting portfolios with options instead of bonds. First is that the option payoff is cued off of the equity index itself, so we know with certainty that the put option payoff will be anticorrelated with the drawdown. Bonds on the other hand have been observed to actually correlate with equities during times of stress, removing their short-term hedging qualities, and effectively becoming a cash holding at best if held to maturity. Pulling this thread even further, option strategies can be designed to explicitly introduce convexity, which can lead to portfolio performance that is actually positive during times of extreme stress, due to the incredible leverage that can be embedded in options.
How much you spend on options, and the type of protection you structure in your options overlay, ultimately answers the question as to whether an option overlay is a smart replacement for bonds. Let's now build a protective downside option overlay and see how it stacks up against bonds for managing total portfolio risk.
Option strategies can be designed to explicitly introduce convexity, which can lead to portfolio performance that is actually positive during times of extreme stress, due to the incredible leverage that can be embedded in options.
Equities With Put Protection
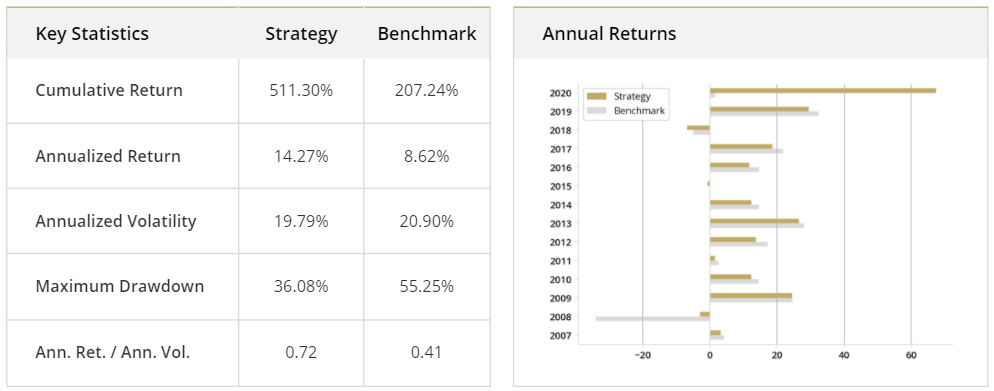
Let’s consider a strategy that hypothetically invests 98% of assets into a core equity exposure like the S&P 500 and invests 2% of asset annually into a smart put option strategy that is designed to outperform the benchmark when markets experience significant downturns, precisely the moment you would be most heavily reliant on an asset like bonds to diversify your core equity exposure. The put overlay component consists of a series of deep out of the money put options at different expiries, which are rolled systematically, and potentially also monetized before their expected roll date. Figure 1 shows the hypothetical results from 2007-2020 for this downside convexity strategy, where the put overlay allocates 30% to 3m/50%otm puts and the rest in 2 sets of 1yr/50%otm puts (offset from each other by 6m), where each option is rolled 1m to expiry, and monetized if they add 15% to the portfolio. At the highest level we can see the summary statistics in the left panel of Figure 1, where we see large cumulative outperformance by our S&P 500 + put overlay strategy, and also see the maximum drawdown get cut from 55% to 36%. We can get a deeper intuition for the strategy by looking at the annual returns, shown on the right of Figure 1, where we consistently see core beta performance during typical market environments (with a small haircut due to the cost of the options) alongside outsized performance in the two periods of stress that occurred during the full studied period. And as mentioned earlier, a deeply convex strategy can sometimes even provide strongly positive hypothetical performance during times of stress, which is exactly the behavior we see in the studied period in March of 2020 (and almost see in 2008).
Figure 1: Hypothetical Put Strategy from 1/1/07 to 7/31/20; Benchmark is S&P 500 IndexSources: QuantQuote & Options Price Reporting Authority. Calculations by Simplify Asset Management. The results are hypothetical results and are NOT an indicator of future results and do NOT represent returns that any investor actually attained. Hypothetical strategies and indices presented are unmanaged, do not reflect management or trading fees, and one cannot invest directly in an index. Additional information regarding the construction of these results is available upon request. PLEASE SEE FULL DISCLOSURES BELOW.
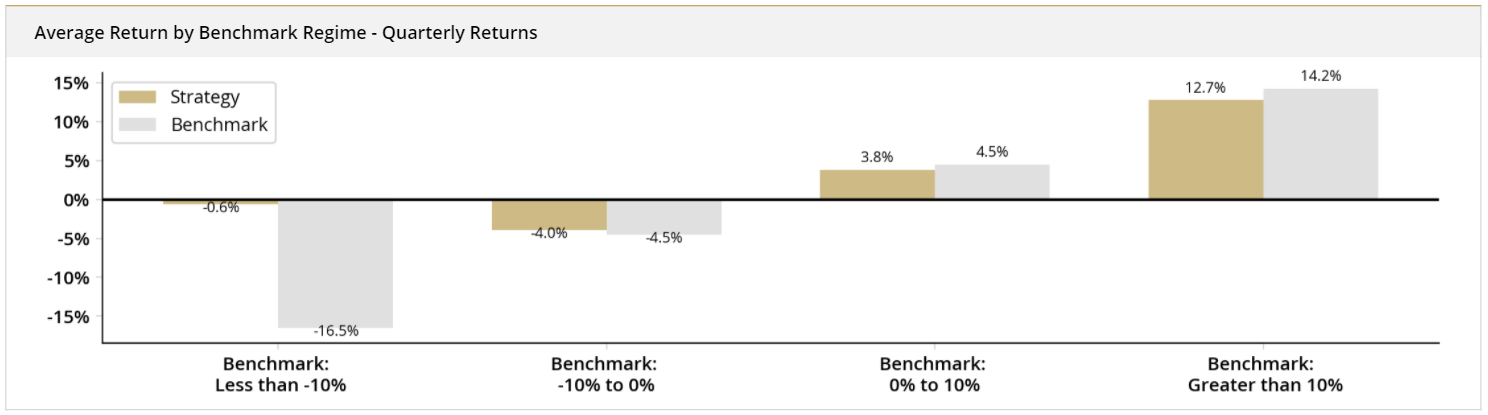
Another helpful view of the convexity offered by the put strategy just considered is shown in Figure 2, which displays the average strategy return in four distinct benchmark return regimes. As you can see, when the benchmark regime is strongly negative (less than -10% in a given quarter), the put strategy averages a return near zero. And as one may expect given the fixed budget deployed, there is only a minimal drag to performance in all three of the other regimes. These two features paired together is precisely the definition of convex, where you get outsized benefits on one side of the distribution of outcomes with only linear detraction on the other side, in stark contrast to a traditional hedge strategy which would generally penalize you on the upside in proportion to the protective benefit received on the downside.
Figure 2: Average Hypothetical Put Strategy Quarterly Returns In Four Benchmark Regimes from 1/1/07 to 7/31/20; Benchmark is S&P 500 IndexSources: QuantQuote & Options Price Reporting Authority. Calculations by Simplify Asset Management. The results are hypothetical results and are NOT an indicator of future results and do NOT represent returns that any investor actually attained. Hypothetical strategies and indices presented are unmanaged, do not reflect management or trading fees, and one cannot invest directly in an index. Additional information regarding the construction of these results is available upon request. PLEASE SEE FULL DISCLOSURES BELOW.
We opened this conversation in search of a differentiated way to protect an equity portfolio from drawdowns, and while the hypothetical strategy just presented indeed helped protect a core equity position, it also provided large cumulative return benefits by the virtue of its convex nature and the power of compounding, a potentially unexpected but welcome benefit of a smart convex design when combined with extreme events like 2008 and 2020.
A Comparison With Bond Diversification
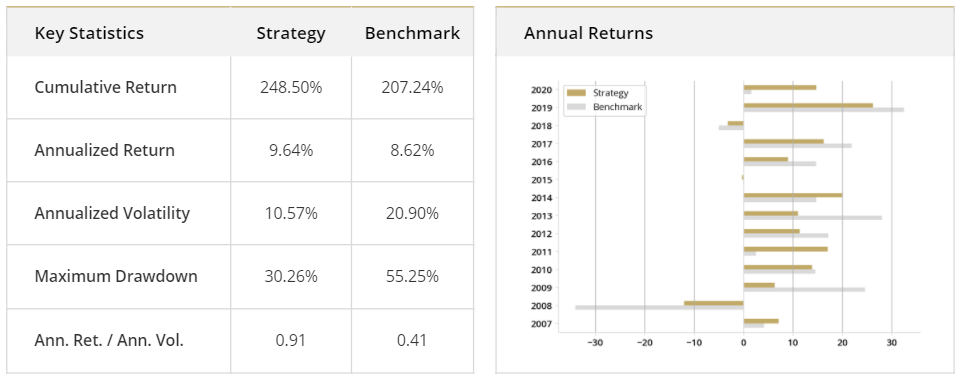
Can a defensive options-based strategy like the one just laid out really be a viable replacement for the standard paradigm of bond diversification? Figure 3 shows the hypothetical results for a classic 60/40 portfolio, where SPY is our equity proxy and TLT is our Treasury proxy. As you can see, the 40% diversification sleeve indeed provides nice protection during extreme drawdown events of 2008 and 2020, but the cumulative return suffers relative to the downside convexity strategy due to the opportunity cost of holding bonds in lieu of equities and the lack of convexity in the bonds. The hypothetical calendar returns also clearly highlight how the protection via bonds consistently mutes returns during normal periods, highlighting the linear nature of this kind of downside protection, in stark contrast with the convex solution of Figure 1 that naturally offers non-linear protection and limits portfolio drag to 2% in normal periods. The one main distinction the 60/40 portfolio holds relative to the earlier put overlay strategy is that its volatility is substantially lower. This makes sense since the convex option strategy isn’t designed to shrink the volatility of the total portfolio, but rather it is designed to cut off the left side of the return distribution, an asymmetric effect that wouldn’t modify the volatility which is a symmetric risk statistic. Risk targeting of client portfolios for their preferred level of risk aversion is a key component of the advisor's fiduciary responsibility, and in our next blog post we show how a downside convexity strategy can fit into a portfolio with a set risk tolerance.
Figure 3: Hypothetical 60/40 Portfolio from 1/1/07 to 7/31/20; Benchmark is S&P 500 IndexSources: QuantQuote & Options Price Reporting Authority. Calculations by Simplify Asset Management. The results are hypothetical results and are NOT an indicator of future results and do NOT represent returns that any investor actually attained. Hypothetical strategies and indices presented are unmanaged, do not reflect management or trading fees, and one cannot invest directly in an index. Additional information regarding the construction of these results is available upon request. PLEASE SEE FULL DISCLOSURES BELOW.
Parting Words
The prospect of diversifying equity-centric portfolios with bonds has been clouded given where yields are, and it begs the question of whether there are other tools to help protect portfolios. We have shown how a theoretical systematic strategy invested 98% in the S&P 500 and 2% in a convex put option overlay could generate equity returns while protecting the downside, netting into a compelling cumulative return due to the power of convexity and compounding.